Nudges, Ideas and a sprinkle of career advice
This is where you’ll read from me. It’s a mix of nudges that encourage you to take the next bold step, ideas that help you make a change and advice so you can avoid the mistakes I made along the way.
From my keyboard to you. No ChatGPT involved, just a bunch of honest writing, usually done in the morning hours before the world wakes up.
I hope you enjoy it and I’d love to hear from you, so feel free to comment on these posts.
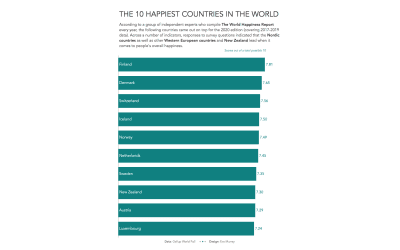
#MakeoverMonday Week 19 2020: World Happiness Report
This week we’re looking at the World Happiness Report 2020, which lists over 150 countries in order of their reported happiness, based on a survey conducted by Gallup.
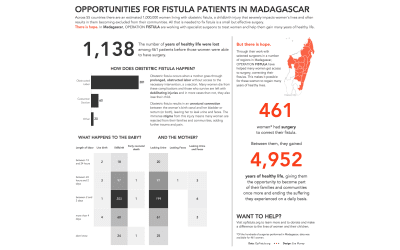
#MakeoverMonday 2020, Week 18: Obstetric Fistula in Madagascar
For week 18 we are tackling another #Viz5 subject, this time the topic of obstetric fistula, which is the focus of our #MakeoverMonday collaboration partner Operation Fistula.
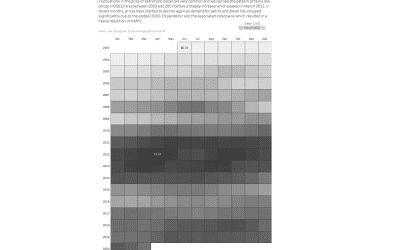
#MakeoverMonday 2020, Week 17: Pump prices over time
For week 17 we’re looking at UK petrol and diesel prices at a weekly level.
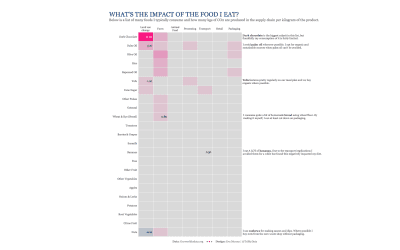
#Makeovermonday Week 2020, Week 16: Greenhouse Gas Emissions across the food supply chain
As we all eat multiple times a day, I decided to look for a visualization about food and found one about the emissions linked to different types of foods.

#MakeoverMonday 2020, Week 15: Messi vs Ronaldo
This week it's a lighter topic. Football. I like it! Charlie chose a Viz from Soccerment, comparing goals per match in La Liga by Messi vs Ronaldo. Here is the original: https://soccerment.com/wp-content/uploads/2017/09/Messi_CRonaldo_GoalsPerMatch-768x401.png I wrote...
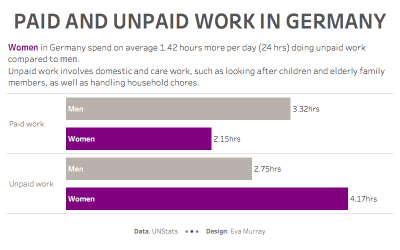
#MakeoverMonday 2020, Week 14: Unpaid work – allocation of time and time-use
It is another week for a Viz5 dataset as part of our collaboration with Operation Fistula. This month, we’re looking at the topic of unpaid work.
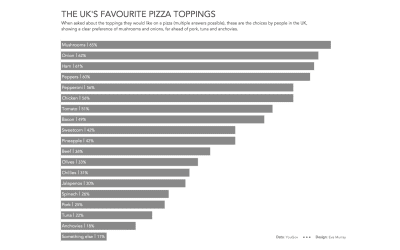
#MakeoverMonday 2020 Week 13: Does pineapple belong on a pizza?
I'm pretty partial to food topics and this week Charlie chose an 'excellent' viz very much in need of a makeover, showing people's favourite pizza toppings. The data behind it is nice and simple, so this week, rather than delaying my viz building until Thursday, I'm...
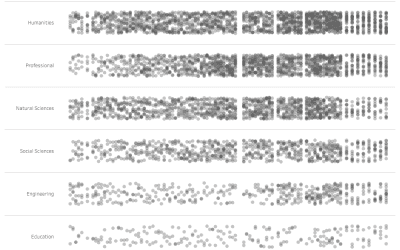
#MakeoverMonday 2020, Week 12: Number of fields of study at California University
Here’s a viz about what’s been taught at University of California
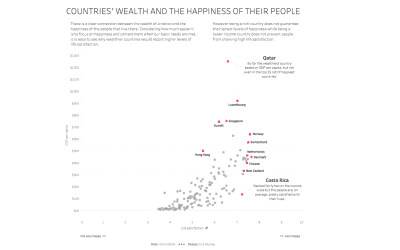
#MakeoverMonday 2020, Week 11: Self-reported life satisfaction vs GDP per capita
For this week’s #MakeoverMonday challenge, Charlie chose a chart from ‘Our World in Data’ on Live Satisfaction vs GDP per capita.
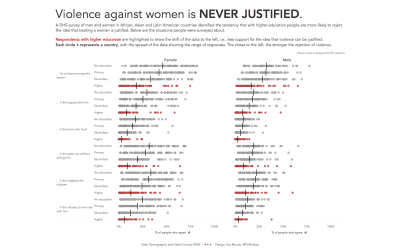
#MakeoverMonday 2020, Week 10: Violence against Women and Girls
This week we launched the Visualize Gender Equality campaign #Viz5 and we are starting with a heavy topic: violence against women and girls and the perception of women and men towards violence being justified.
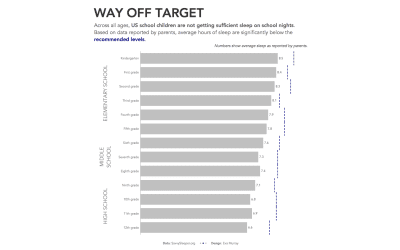
#MakeoverMonday 2020, Week 9: Sleep Hours Needed Vs. Averaged
On a Monday morning here in London, the topic of sleep seems pretty appropriate, I have to admit, because getting enough sleep between various work and life commitments (and choices) can be a struggle.
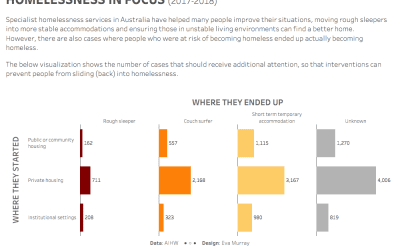
#MakeoverMonday 2020, Week 8: Australian Homelessness Services Housing Outcomes
For week 8 I chose a dataset from the Australian Institute of Health and Welfare, looking at homelessness statistics and, more particularly, the outcomes of specialist homelessness services.