by Eva Murray | Dec 9, 2019 | Tableau
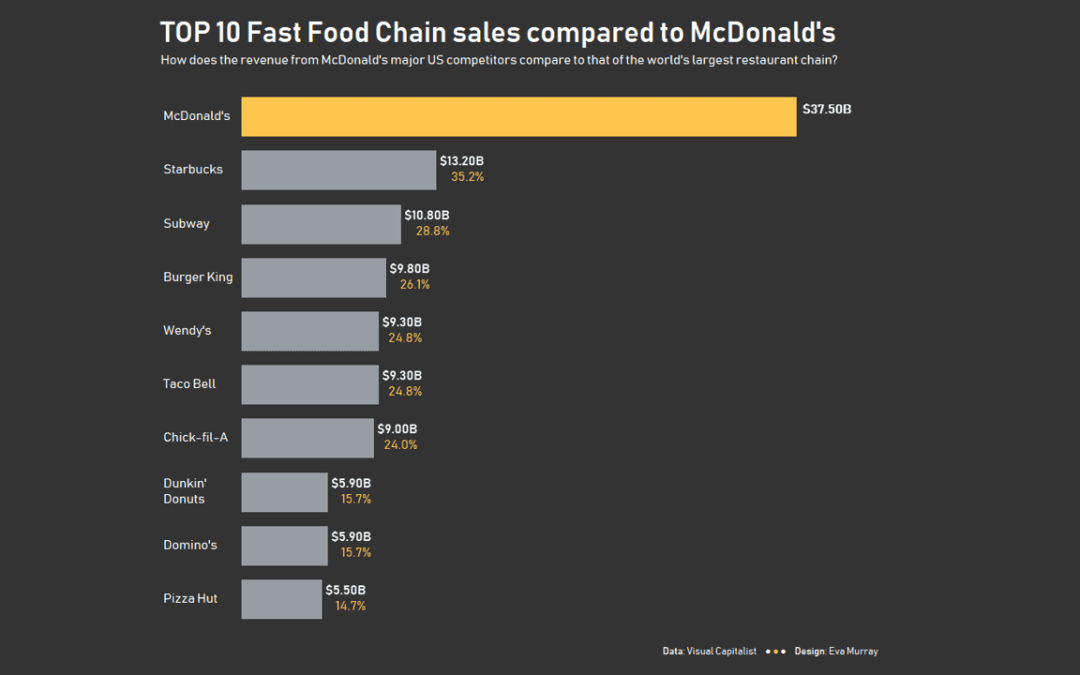
For week 50 of Makeover Monday in 2019, we’re analysing the revenue of America’s biggest fast food chains. Thanks to Andy for finding the viz and the data when all my search efforts resulted in terrible results. Here is the original viz from Visual...
by Eva Murray | Nov 18, 2019 | Tableau
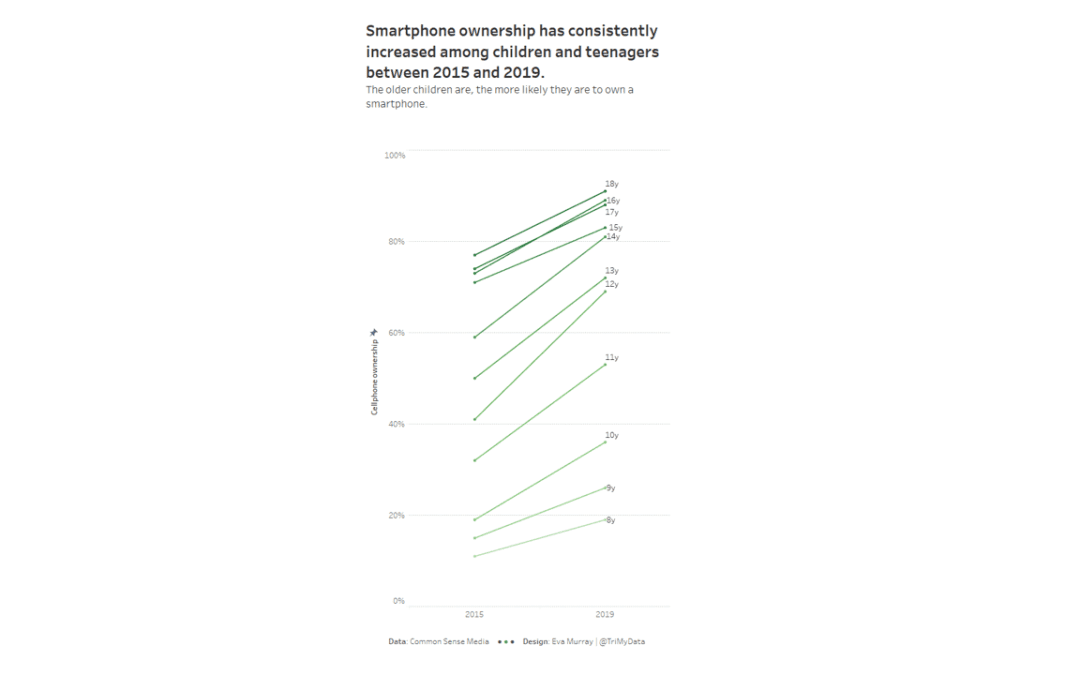
Given the buzz of #data19 last week, we’re working with a small and simple dataset for week 47, so we can all have some extra time to catch up on the things we missed at home. Here is the original viz: What works well: The colors draw my attention. The line...
by Eva Murray | Nov 12, 2019 | Tableau
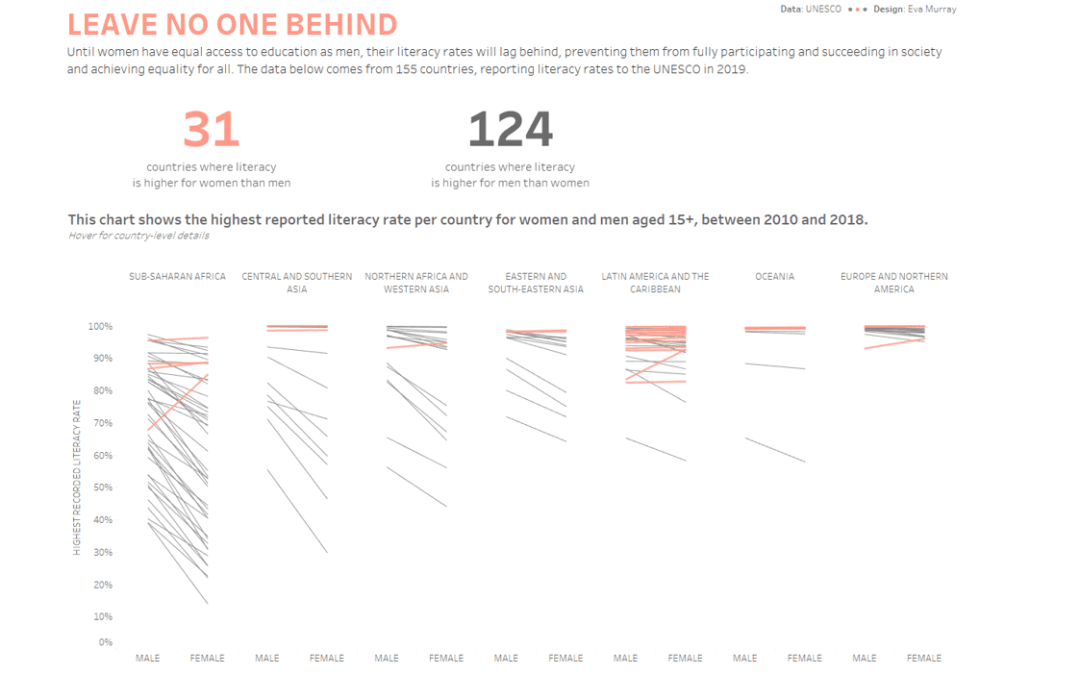
#data19 has arrived and with it a live #MakeoverMonday session with A LOT of people. We want to use that opportunity of getting everyone in a room with their ideas and skills to tackle a topic that is very relevant today. Literacy and how literacy rates differ across...
by Eva Murray | Nov 4, 2019 | Tableau
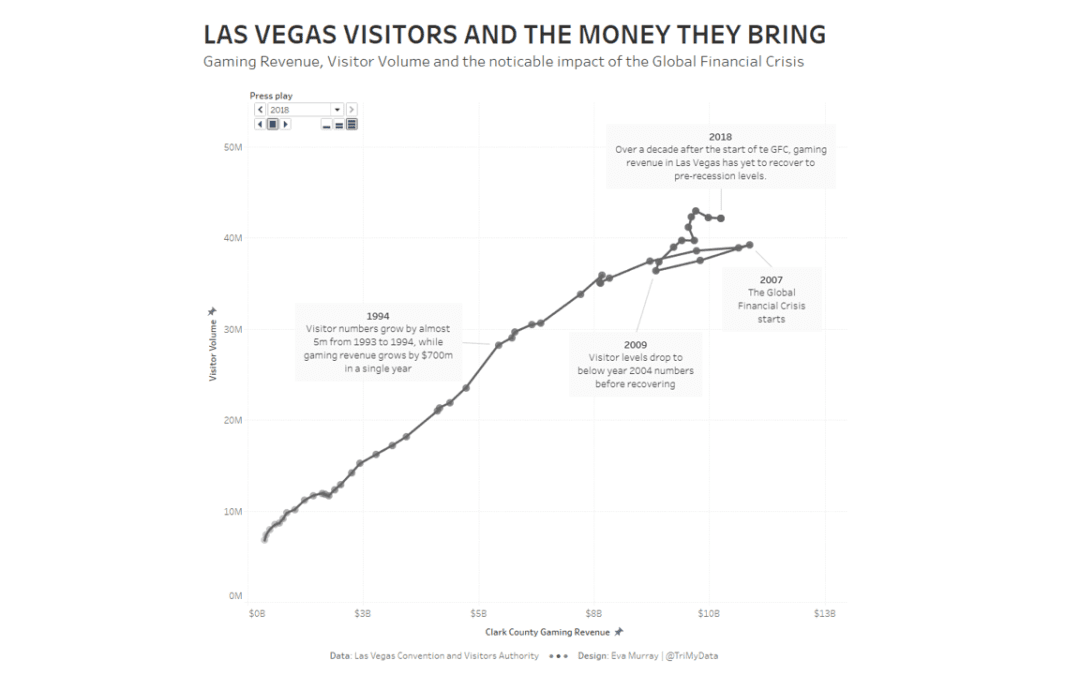
For week 45, Andy selected a dataset about Las Vegas. Itcontains a number of metrics, including visitor numbers, gaming revenue,occupancy rates, etc. This is the original viz What works well: The bar chart is simply and easy to read The line shows an interesting...
by Eva Murray | Oct 28, 2019 | Tableau
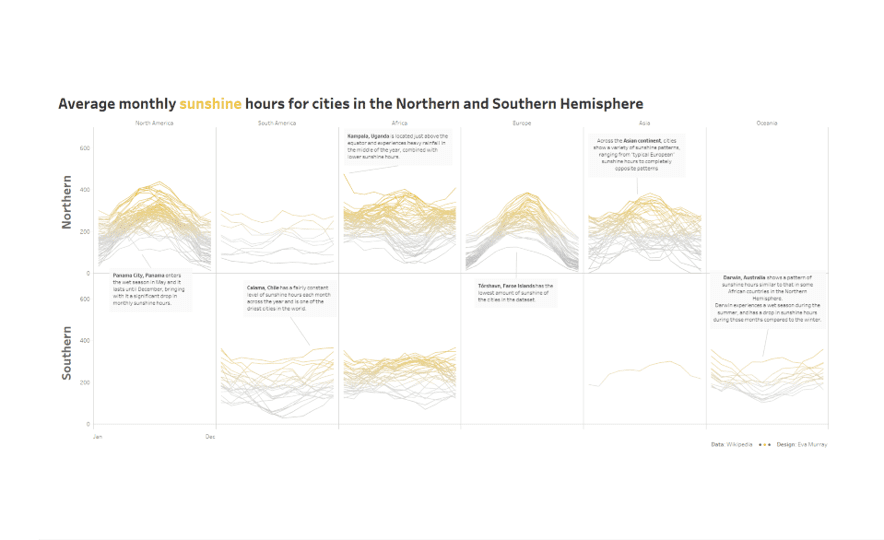
Before winter really takes hold, let’s look at some sunshine hours in cities around the world. Here is this week’s original: What works well: Captivating visual that makes me curious The bar charts at the bottom are nice Top 5 lists at the beginning are...