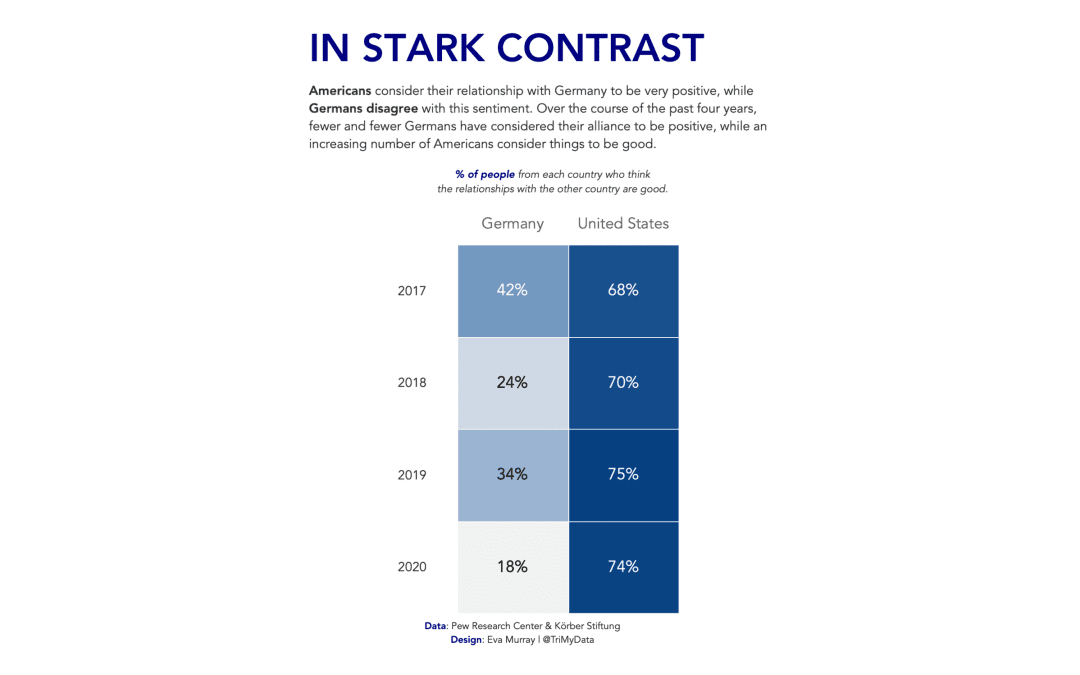
by Eva Murray | Dec 9, 2020 | Makeover Monday, Tableau
For this week Charlie picked an interesting topic: The perception among the population of how positive the relationship is between the US and Germany. The data came from a survey and the entire article can be found here. Here is the original visualization:...
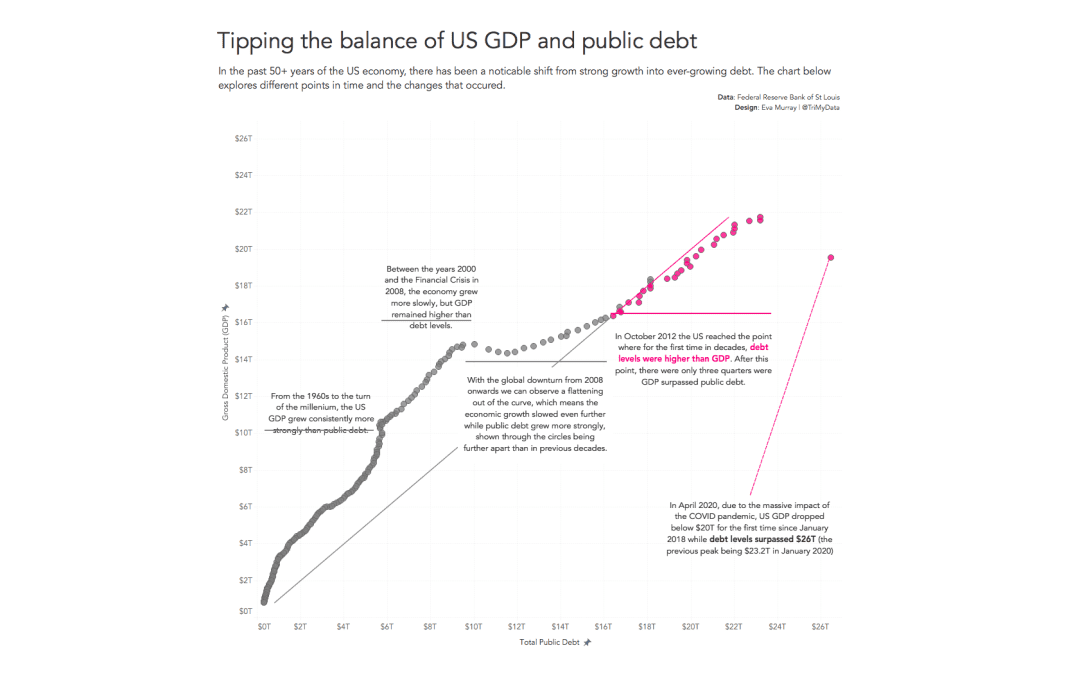
by Eva Murray | Nov 25, 2020 | Makeover Monday, Tableau
This week is, much like many recent weeks, a busy one for me with many commitments that mean MakeoverMonday had to be delayed by a couple of days. But here we are, ready to build a viz about the debt of the US. The original infographic Charlie chose for this exercise...
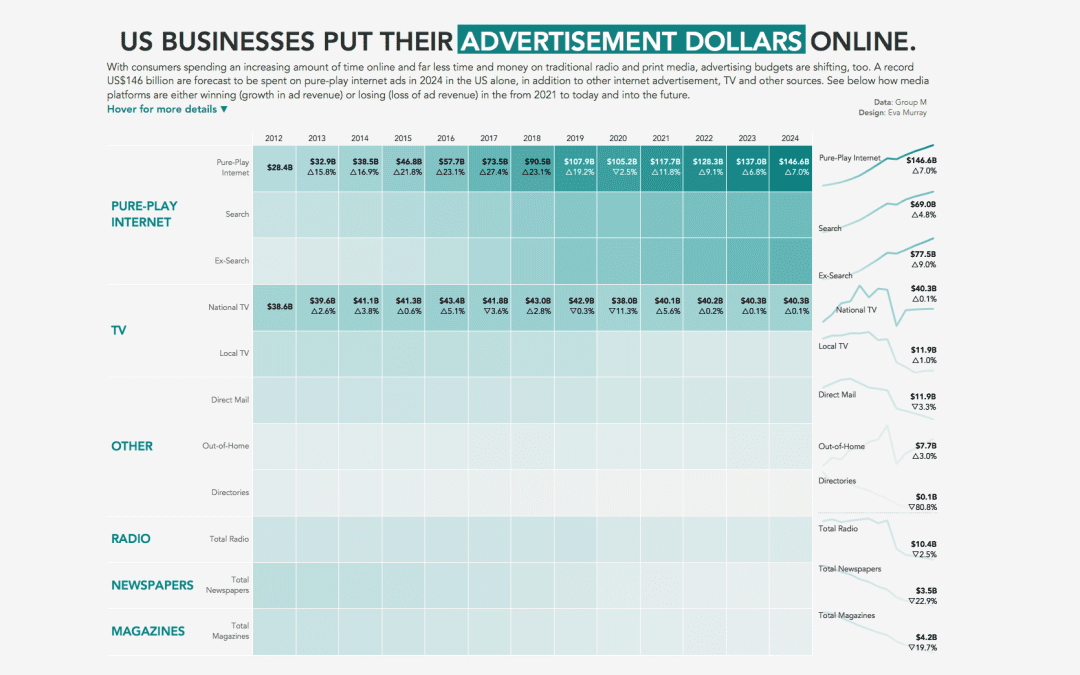
by Eva Murray | Nov 16, 2020 | Makeover Monday, Tableau
Andy found a great viz for this week’s #MakeoverMonday challenge and kindly dug out the data for me as well as I’m managing a few different projects at the same time. This week we’re looking at advertising spend in the US with the original viz...
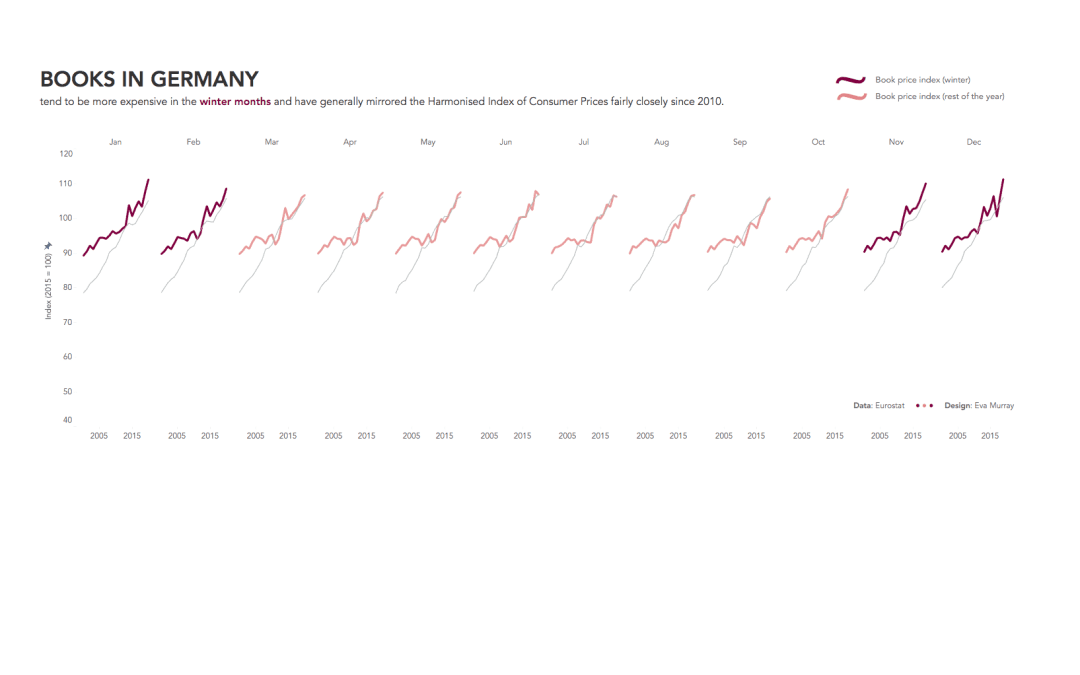
by Eva Murray | Sep 22, 2020 | Tableau
We haven’t used time series data in MM for a while, so I was pleased to find a dataset that combined several years of data at the month level with a topic I love: books and reading. The original visualization comes from Eurostat...
by Eva Murray | Aug 6, 2020 | Tableau
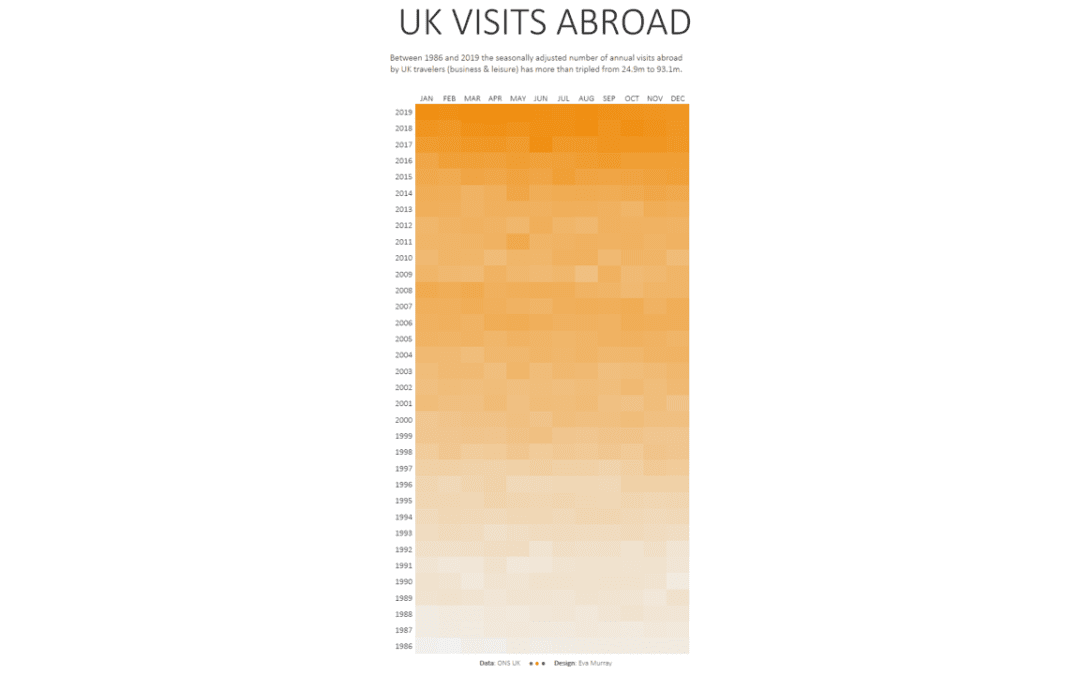
For this week’s #MakeoverMonday we’re looking at how many visits abroad people from the UK are making on a monthly basis. This is the original chart from the Office for National Statistics (ONS): What works well: A line chart is a good choice for this type...