
by Eva Murray | Mar 28, 2021 | Makeover Monday, Tableau
Quick one this week (and I’m skipping the usual assessment of the original viz because after 4 years, I’m sure everyone here knows the drill).Original: Source: https://www.theguardian.com/business/2021/mar/12/exports-to-eu-plunge-in-first-month-since-brexit-uk-economy...

by Eva Murray | Mar 21, 2021 | Uncategorized
I enjoy random topics like the one Andy picked for this week: What did 2020 look like for the cereal industry and what does the data suggest about our cereal consumption habits? (or at least those of people in the US?Here is the original visualization, published on...
by Eva Murray | Mar 10, 2021 | Makeover Monday, Tableau
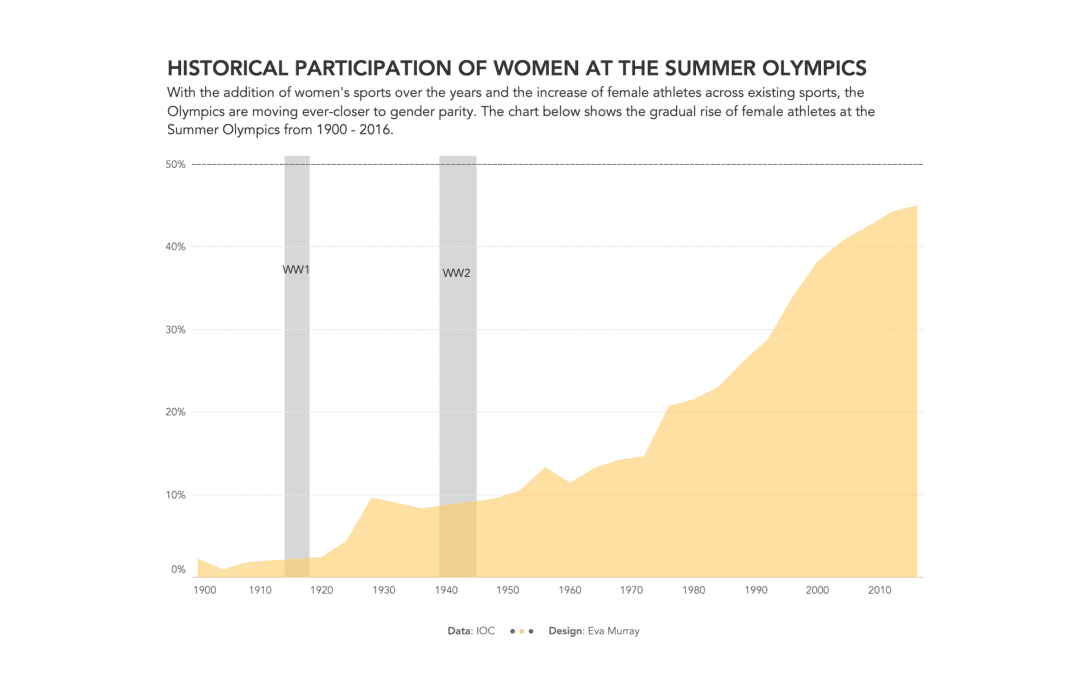
Continuing the theme of gender equality with a focus on topics about women and their situation as it relates to different aspects of life, society, politics, etc., this week’s focus is on participation in the Olympic Games.The original viz comes from swimswam.com and...
by Eva Murray | Feb 4, 2021 | Makeover Monday, Tableau
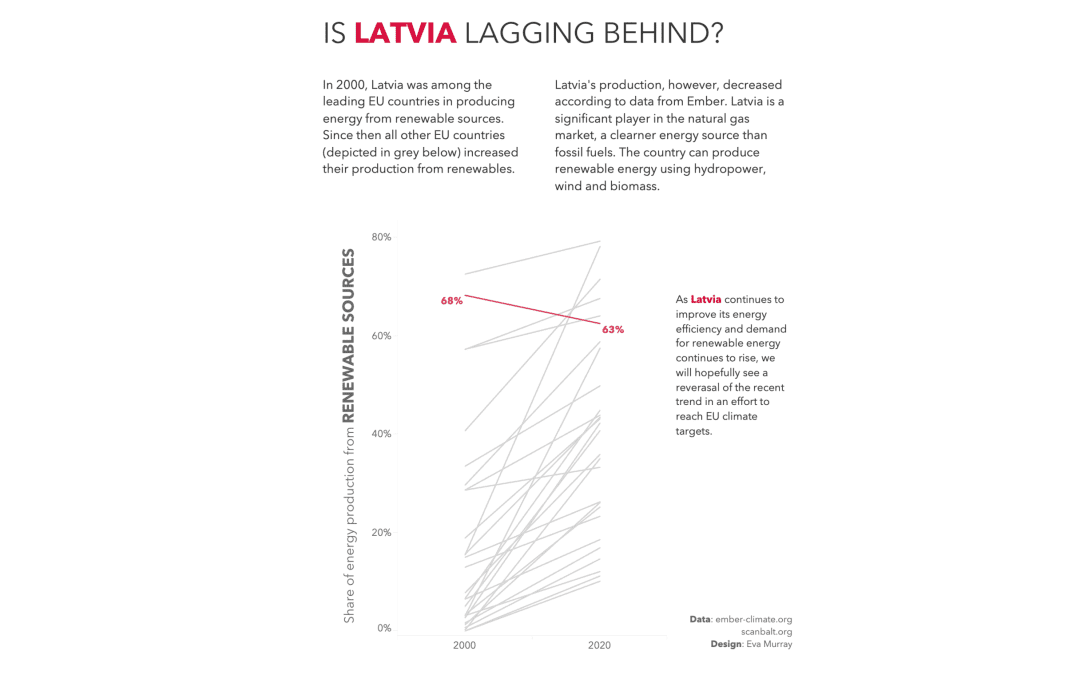
We’re sticking with the energy theme this week and look at renewable versus fossil fuel production in EU countries. The original visualisation comes from the EU Power Sector 2020 report from ember-climate.org: What works well: The title connects well to the...
by Eva Murray | Jan 5, 2021 | Tableau
Finally it’s 2021 and I have to say, I am very excited about this year. 2020 was more challenging and draining than I first thought, so I’m looking ahead to a year that will hopefully be less stressful and more social. As we turn over the calendar to 2021,...