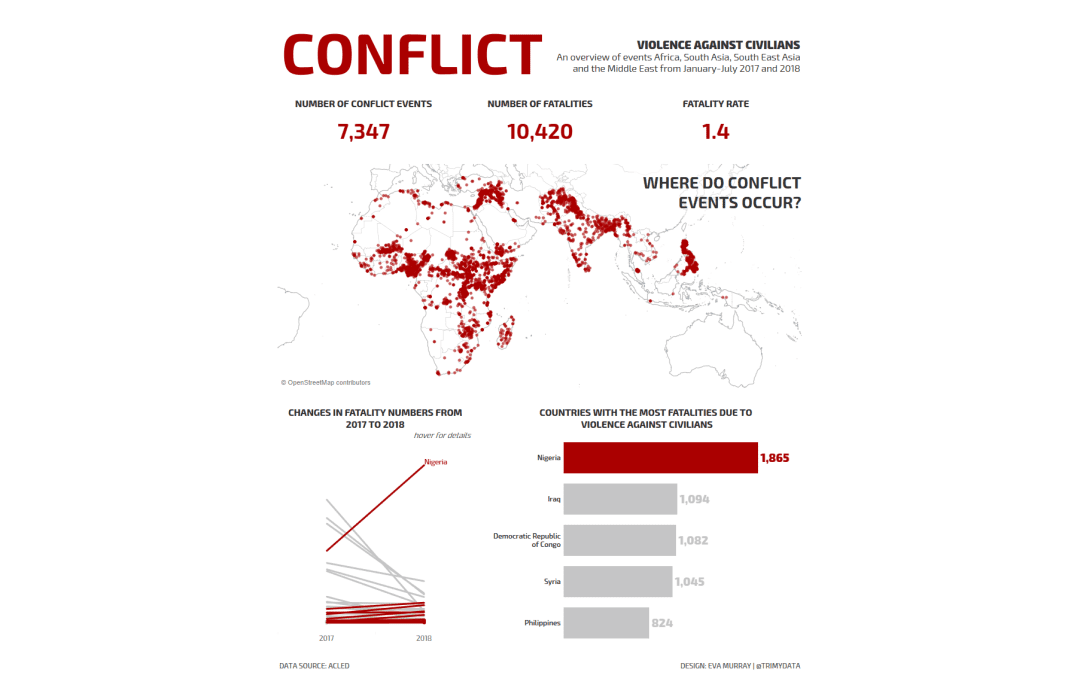
by Eva Murray | Aug 19, 2018 | Tableau
This week we’re collaborating with ACLED to visualize the conflict data they have collected over time.Their original viz looks like this: What works well: Maps always get people’s attention Bright colors that are very different from one another A color...
by Eva Murray | Aug 5, 2018 | Makeover Monday, Tableau
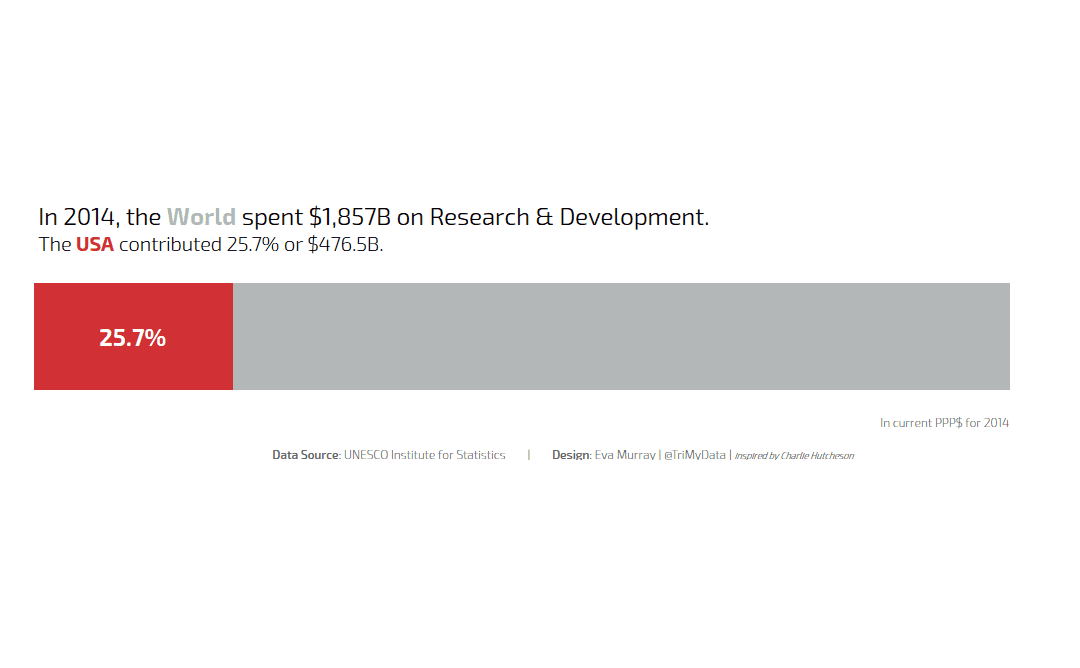
This week’s viz was sent to me by Sarah Bartlett with a ‘WTF’ kinda message and I have to agree. I have seen a lot of bad vizzes and this one has to be in the top 10.We’re looking at what countries spend on Research & Development, data...
by Eva Murray | Jul 31, 2018 | Tableau
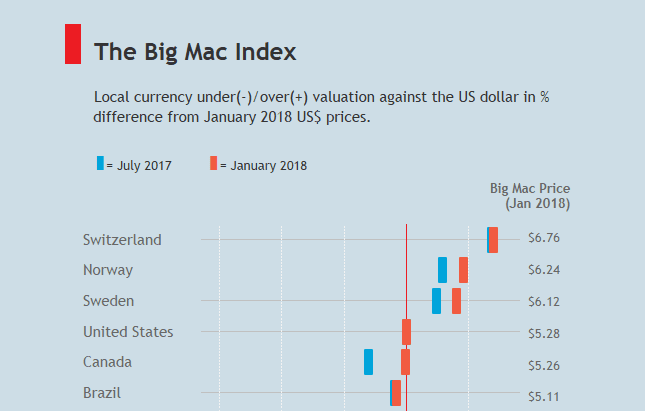
This week we’re working on the dataset behind the Big Mac Index. Many from the community will be familiar with the topic because it featured in this year’s Ironviz Europe contest.A few weeks ago, Andy Cotgreave introduced us to the data team at the...
by Eva Murray | Jul 22, 2018 | Tableau
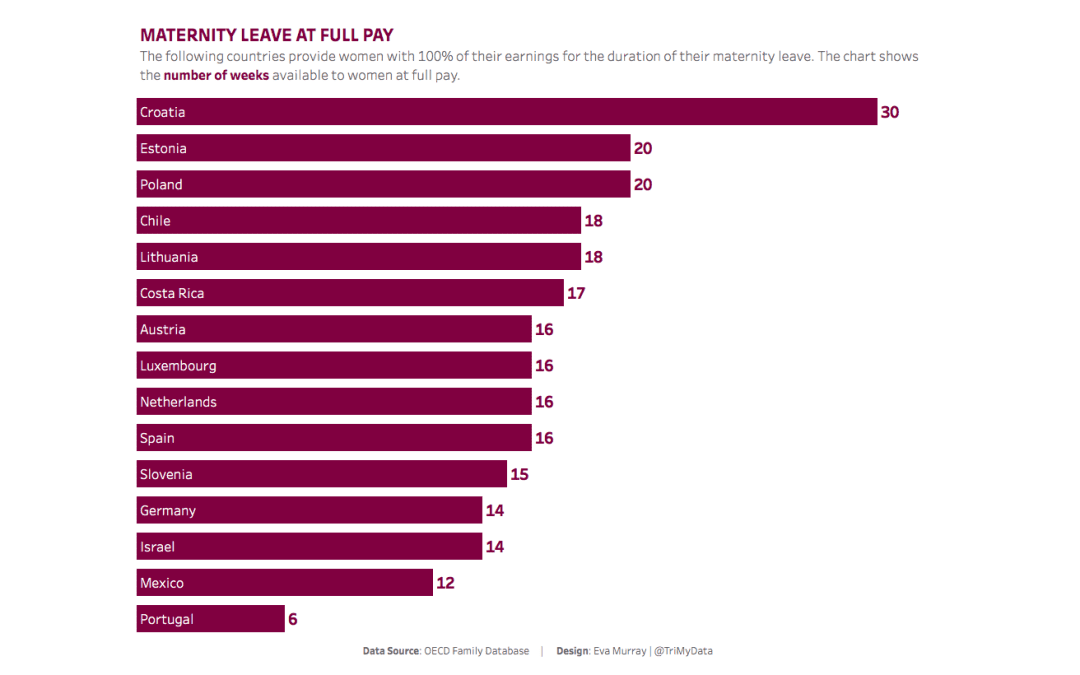
In the past few days I noticed a number of discussions on social media around maternity and parental leave in different countries and, more specifically, the lack of paid maternity leave in the US. So I chose a dataset that shows the number of weeks of maternity and...
by Eva Murray | May 28, 2018 | Tableau
A couple of weeks ago, Sarah Bartlett shared a link to the viz we’re using for this week’s makeover.What’s great is that the dataset is very simple, one dimension and one measure.No doubt there will be richer datasets in the future but what Andy and...