by Eva Murray | Mar 29, 2020 | Tableau
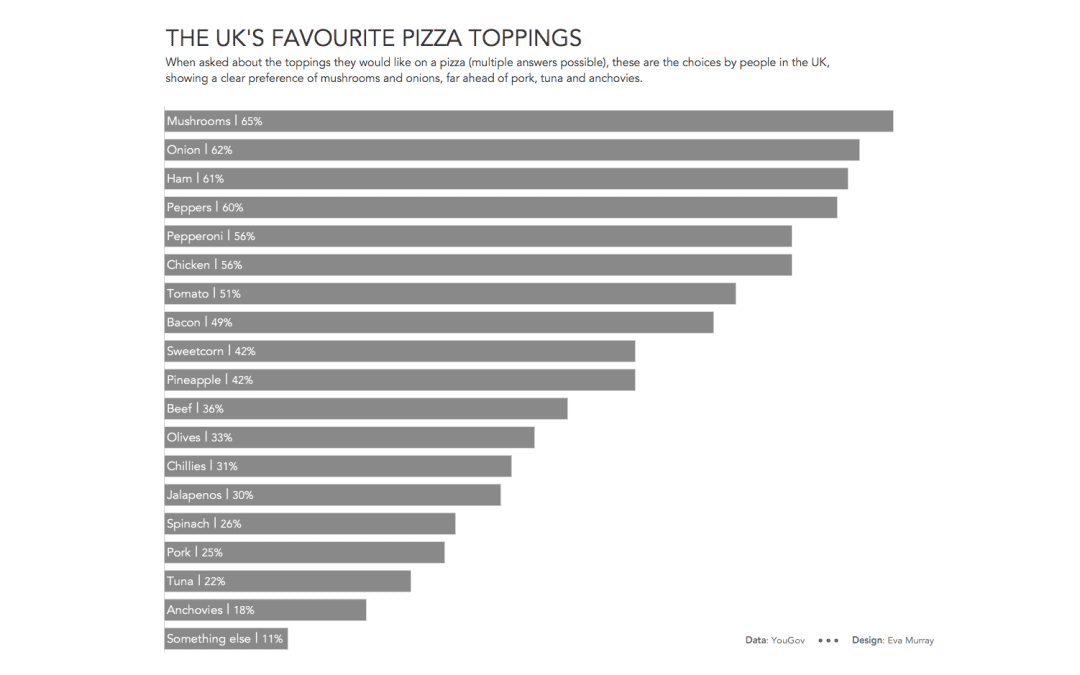
I’m pretty partial to food topics and this week Charlie chose an ‘excellent’ viz very much in need of a makeover, showing people’s favourite pizza toppings. The data behind it is nice and simple, so this week, rather than delaying my viz...
by Eva Murray | Feb 3, 2020 | Makeover Monday, Tableau
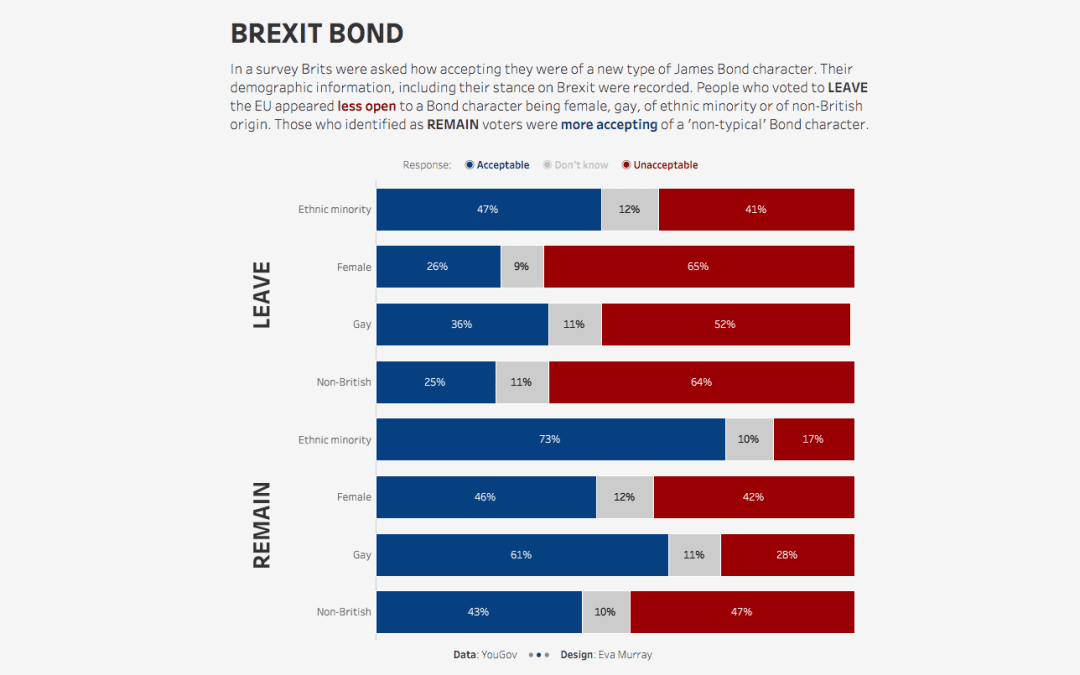
For week 5, Charlie picked an interesting dataset, stemming from a survey of Brits on how they voted in political elections as well as their opinion on James Bond actors and how open they are to a future Bond being female, gay, of ethnic minority origin or...
by Eva Murray | Sep 1, 2019 | Tableau
September 1st is the first day of autumn, meteorologically speaking. So I picked a dataset about how Americans feel about the different seasons. The original viz and data comes from YouGov and looks like this: What works well: It’s a simple bar chart that is...