by Eva Murray | Aug 6, 2020 | Tableau
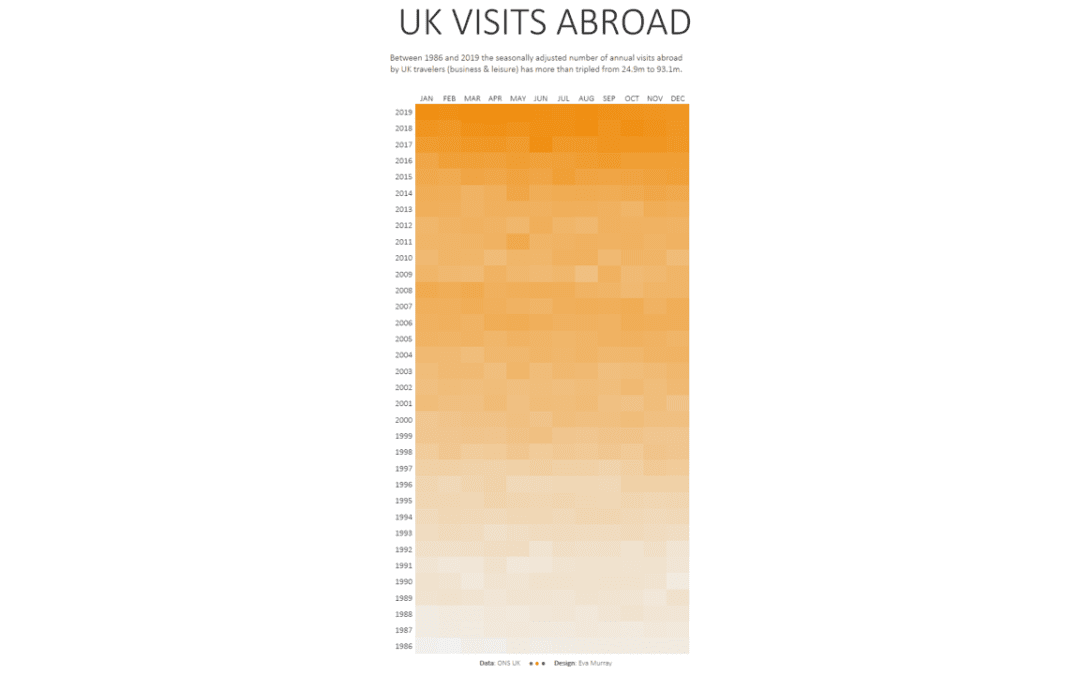
For this week’s #MakeoverMonday we’re looking at how many visits abroad people from the UK are making on a monthly basis. This is the original chart from the Office for National Statistics (ONS): What works well: A line chart is a good choice for this type...
by Eva Murray | Oct 1, 2018 | Tableau
Avocadoes are quite easily the tastiest fatty fruit I know. They’re amazingly delicious and finding a perfectly ripe avocado always feels like a major accomplishment. This week Andy gifted me a dataset about avocado prices, and it’s a nice and simple one....
by Eva Murray | Jun 18, 2018 | Tableau
We are almost halfway through the year and I have no idea where the time has gone so quickly. Wasn’t it just March not long ago???I’ve been enjoying an extended stay in Berlin for the past week and a bit and will be travelling home today (Sunday) to get...