by Eva Murray | Nov 4, 2019 | Tableau
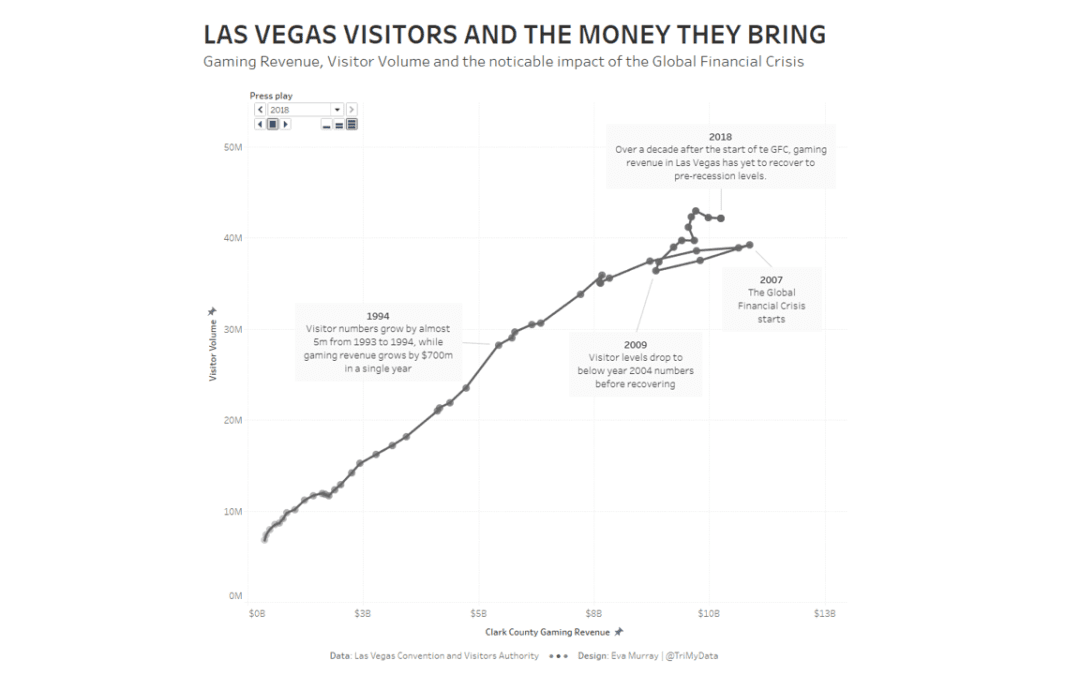
For week 45, Andy selected a dataset about Las Vegas. Itcontains a number of metrics, including visitor numbers, gaming revenue,occupancy rates, etc. This is the original viz What works well: The bar chart is simply and easy to read The line shows an interesting...