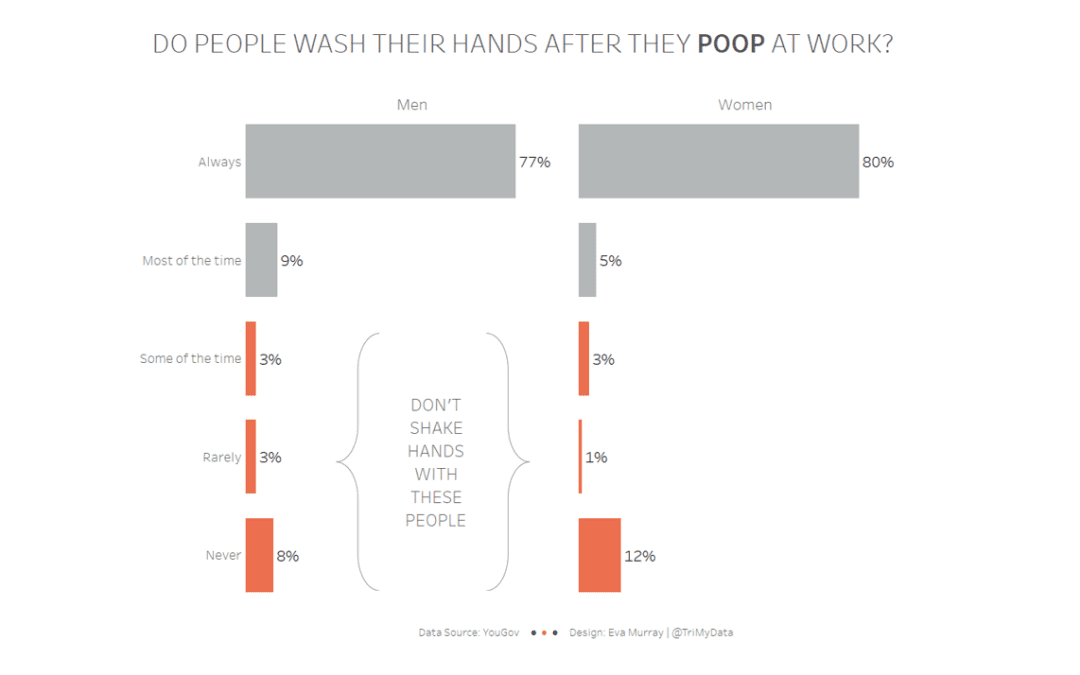
by Eva Murray | Oct 29, 2018 | Tableau
Tackling this Makeover Monday dataset in a slightly zombie state while waiting for my connection from London to Frankfurt as I fly home from TC18 in New Orleans…And then there is a dataset about poo. Who would have thought? But sometimes we need something as...
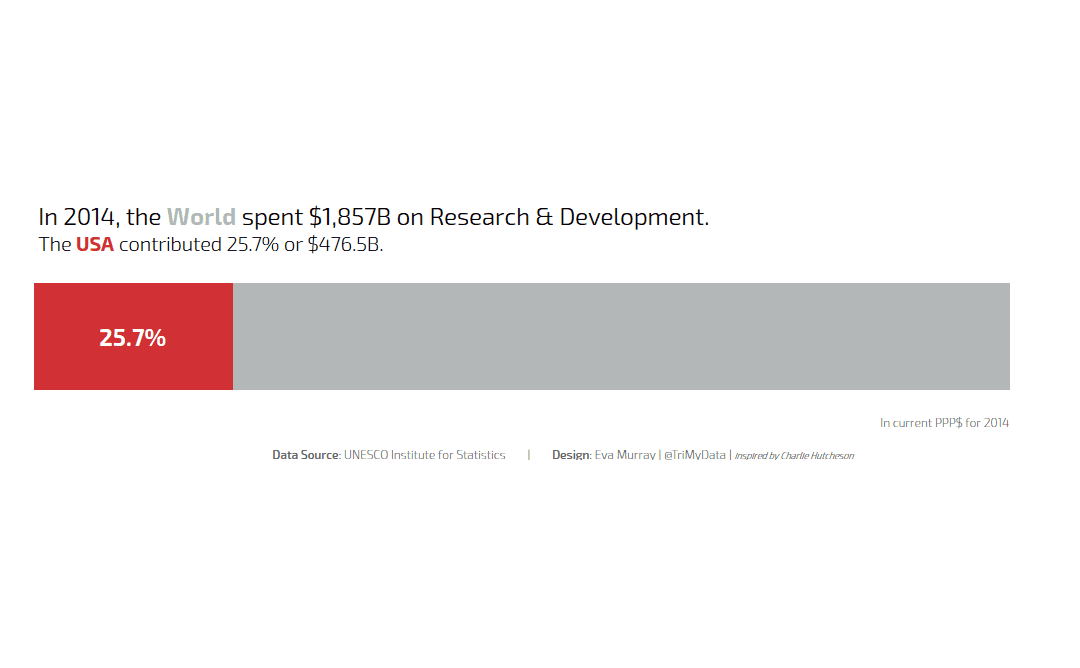
by Eva Murray | Aug 5, 2018 | Makeover Monday, Tableau
This week’s viz was sent to me by Sarah Bartlett with a ‘WTF’ kinda message and I have to agree. I have seen a lot of bad vizzes and this one has to be in the top 10.We’re looking at what countries spend on Research & Development, data...
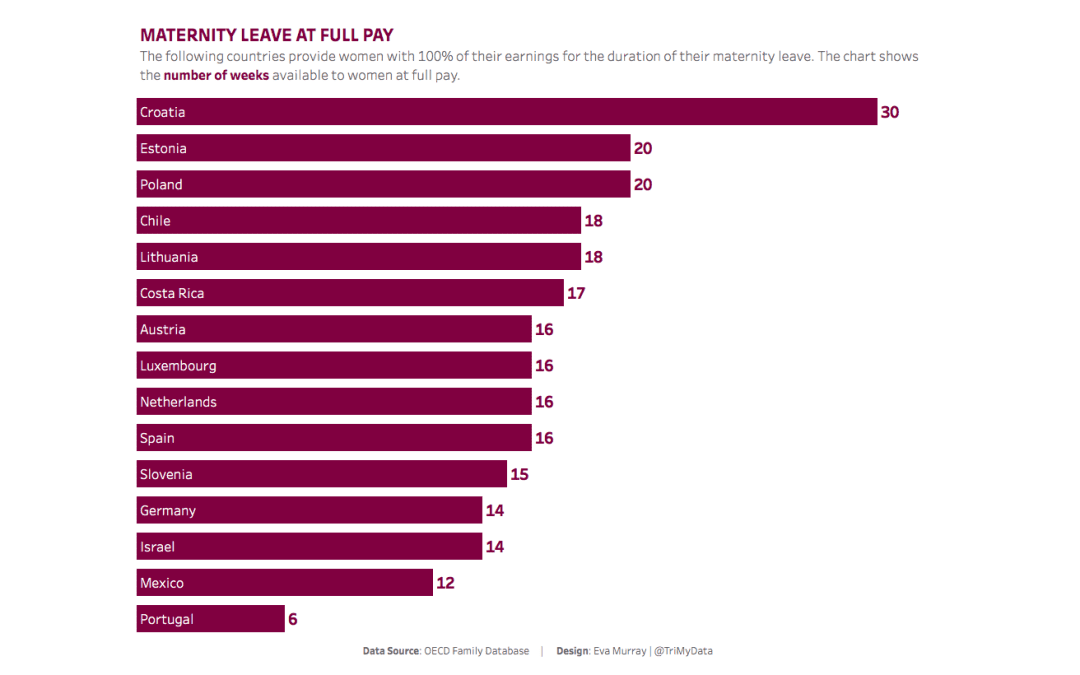
by Eva Murray | Jul 22, 2018 | Tableau
In the past few days I noticed a number of discussions on social media around maternity and parental leave in different countries and, more specifically, the lack of paid maternity leave in the US. So I chose a dataset that shows the number of weeks of maternity and...
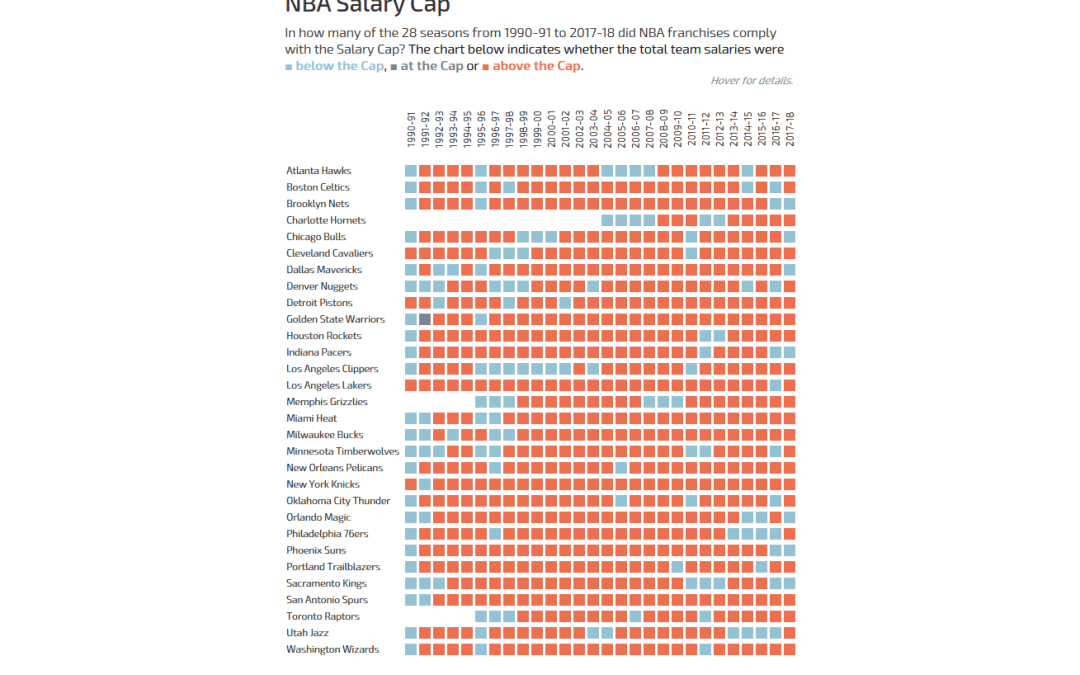
by Eva Murray | Jul 16, 2018 | Tableau
Andy actually did it: he pulled Basketball data on me! But hey, all good, we all have to occasionally work with data we know nothing about.The original viz comes from What’s the Cap? and shows a combined bar chart and line chart to indicate how high the salary...
by Eva Murray | Jun 10, 2018 | Tableau
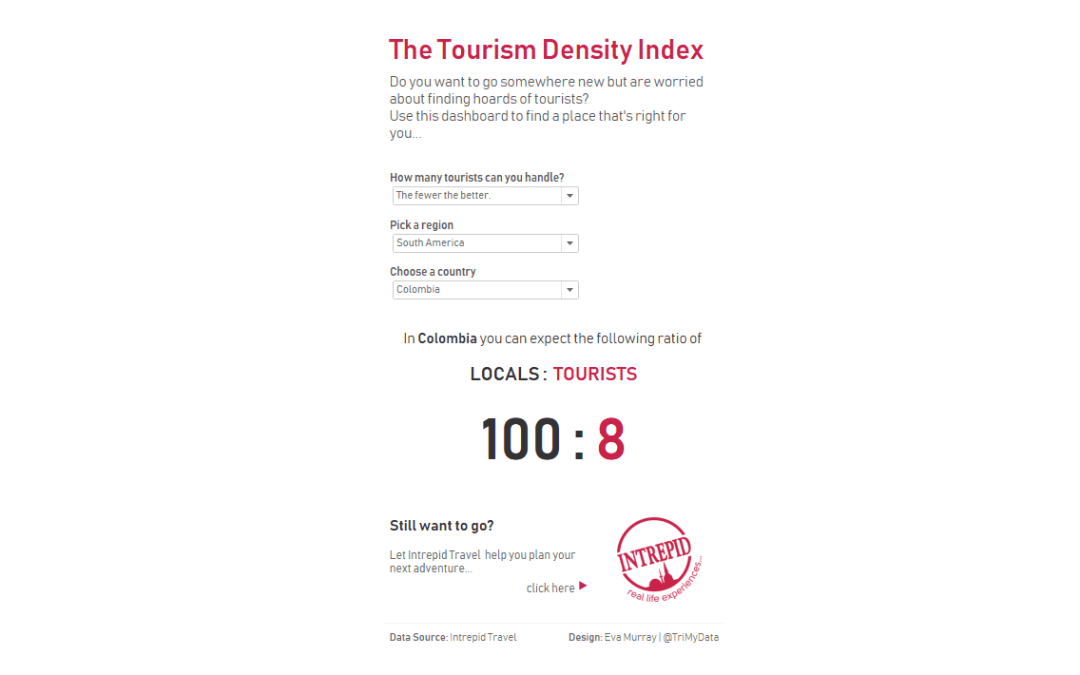
This dataset found its way to me through some sponsored content on an Australian news website recently and I thought the topic was really interesting. At the same time, the dataset is easy to understand yet provides plenty of opportunity for different angles,...