by Eva Murray | Dec 9, 2019 | Tableau
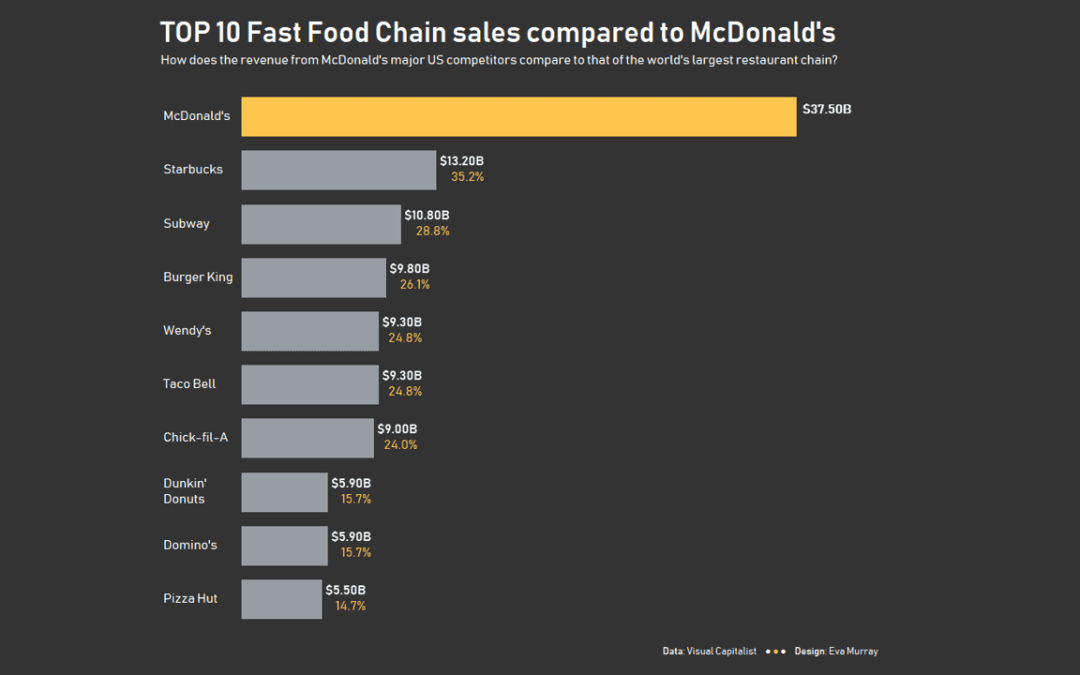
For week 50 of Makeover Monday in 2019, we’re analysing the revenue of America’s biggest fast food chains. Thanks to Andy for finding the viz and the data when all my search efforts resulted in terrible results. Here is the original viz from Visual...
by Eva Murray | Nov 12, 2019 | Tableau
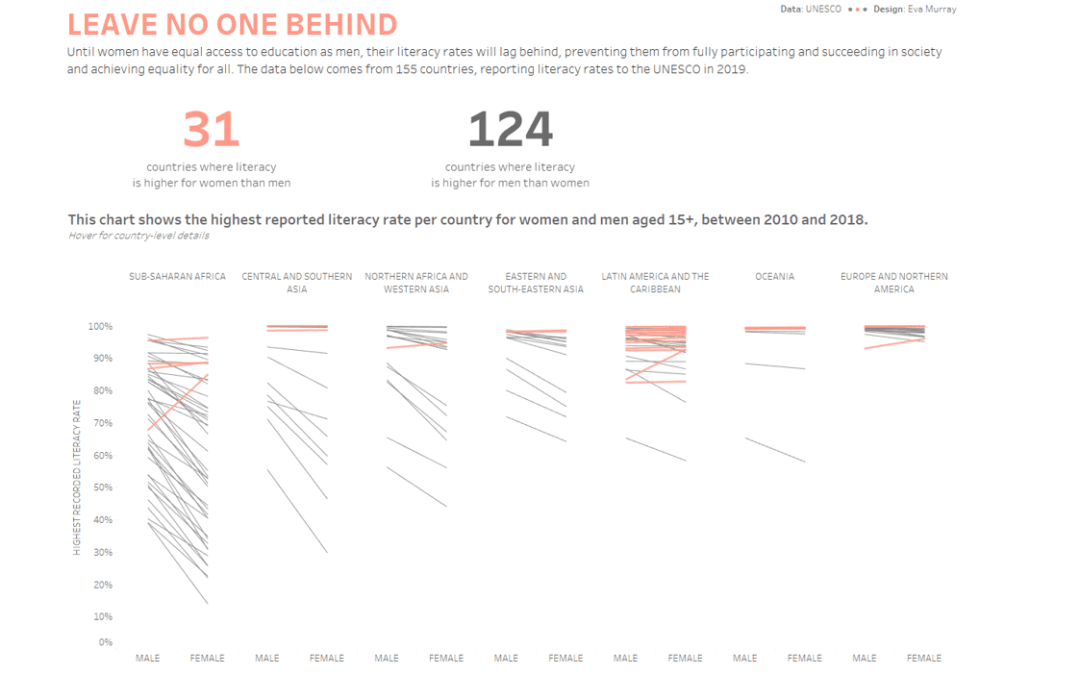
#data19 has arrived and with it a live #MakeoverMonday session with A LOT of people. We want to use that opportunity of getting everyone in a room with their ideas and skills to tackle a topic that is very relevant today. Literacy and how literacy rates differ across...
by Eva Murray | Oct 21, 2019 | Makeover Monday, Tableau
Content warning: This post and the data visualisations within it focus on the topic of suicide. If you are not comfortable with the topic, please don’t feel obliged to continue. If you or someone you know needs help, please contact: Samaritans (UK: 116 123)...
by Eva Murray | Oct 8, 2019 | Tableau
For week 41, Andy chose a dataset about donations accepted by political parties, published by the electoral commission. The visualisation is an interactive Tableau dashboard, but it’s far from best practices and screams for a makeover… Here is what it...
by Eva Murray | Oct 2, 2019 | Tableau
For week 40 I chose a rich dataset with a simple viz showing population predictions for London. The original viz looks like this: https://media.data.world/Iz4UmqNeRlmouvVKnBXx_Screen%20Shot%202019-09-28%20at%207.23.28%20pm.png What works well: A simple bar chart...