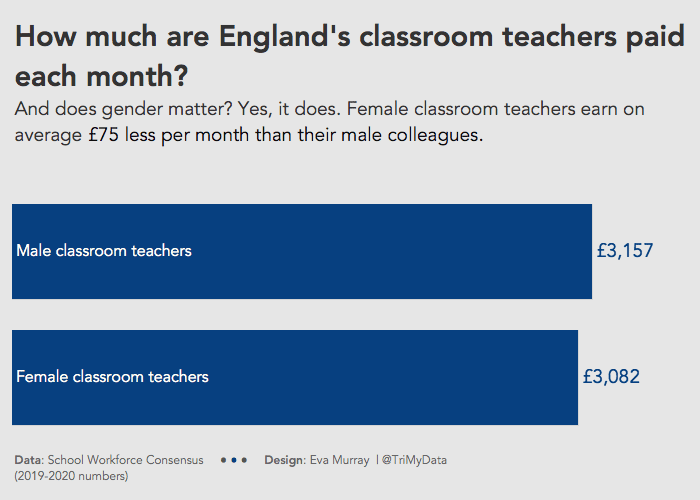
by Eva Murray | Sep 18, 2020 | Makeover Monday, Tableau
This week has to be quick because I’m official on holidays and it’s so sunny outside that it would be criminal to spend too much time in front of a screen. Charlie selected a dataset about teacher salaries in England. I saw a lot of cool visualizations...
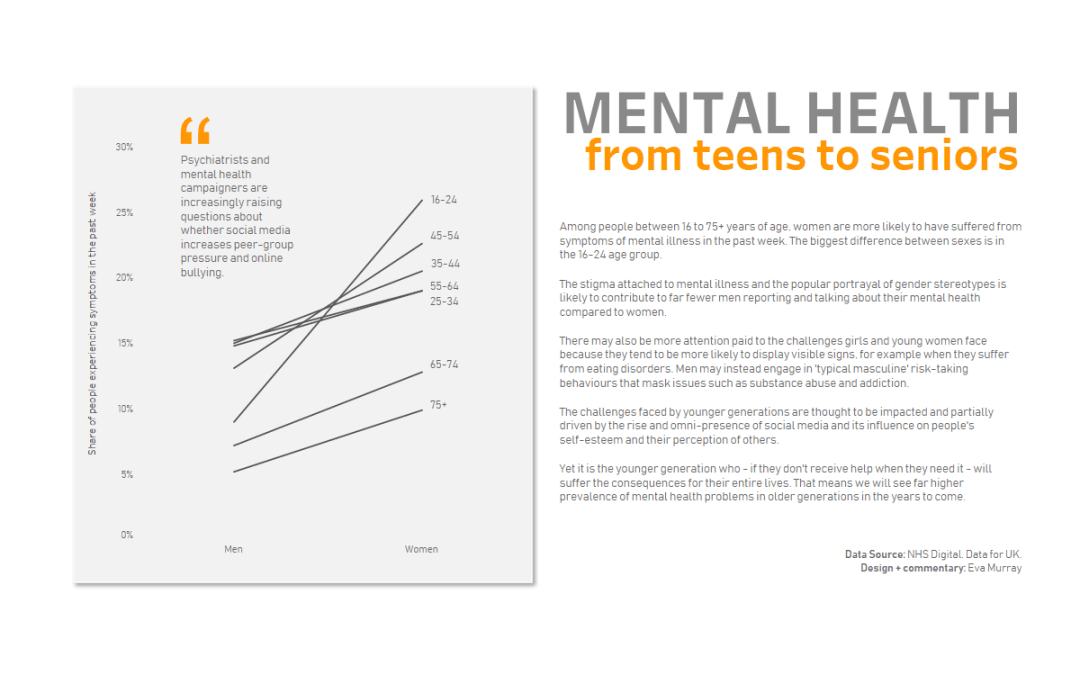
by Eva Murray | Jul 7, 2020 | Makeover Monday, Tableau
For this week’s #MakeoverMonday, Charlie chose a chart from a BBC article about the prevalence of mental health issues between men and women and across different age groups. Here is the original viz:...
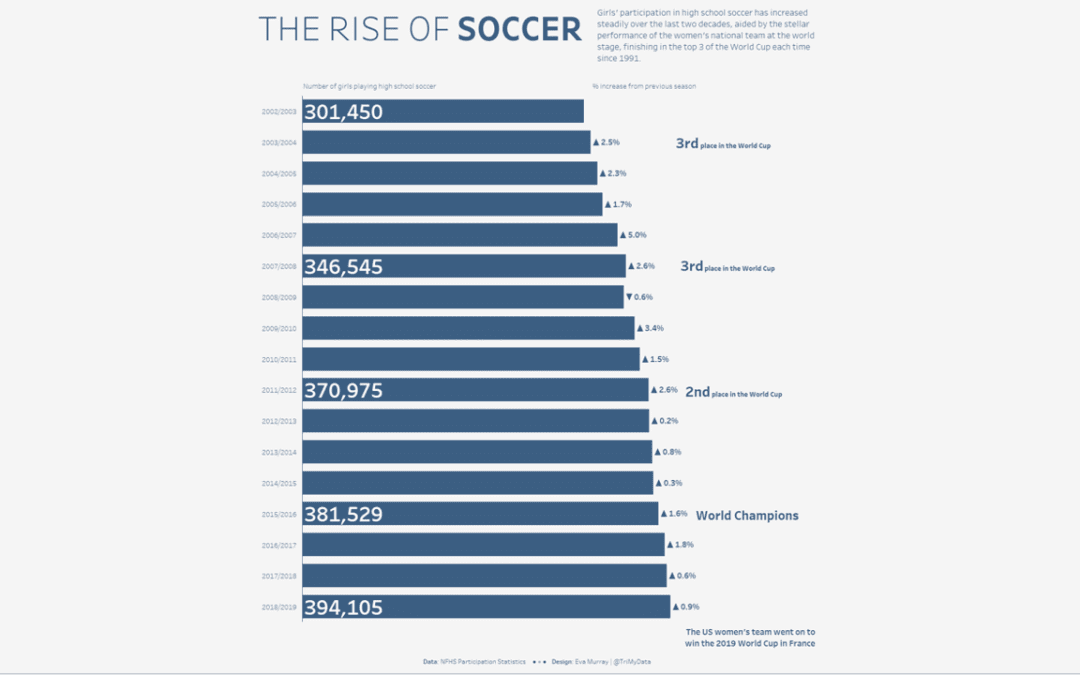
by Eva Murray | Jun 19, 2020 | Makeover Monday, Tableau
In #MakeoverMonday we naturally mix heavier topics with some lighter and easier ones. We also aim to have a good variety of datasets so participants can work with complex, simple, large and small amounts of data, using different visualization and analysis approaches....
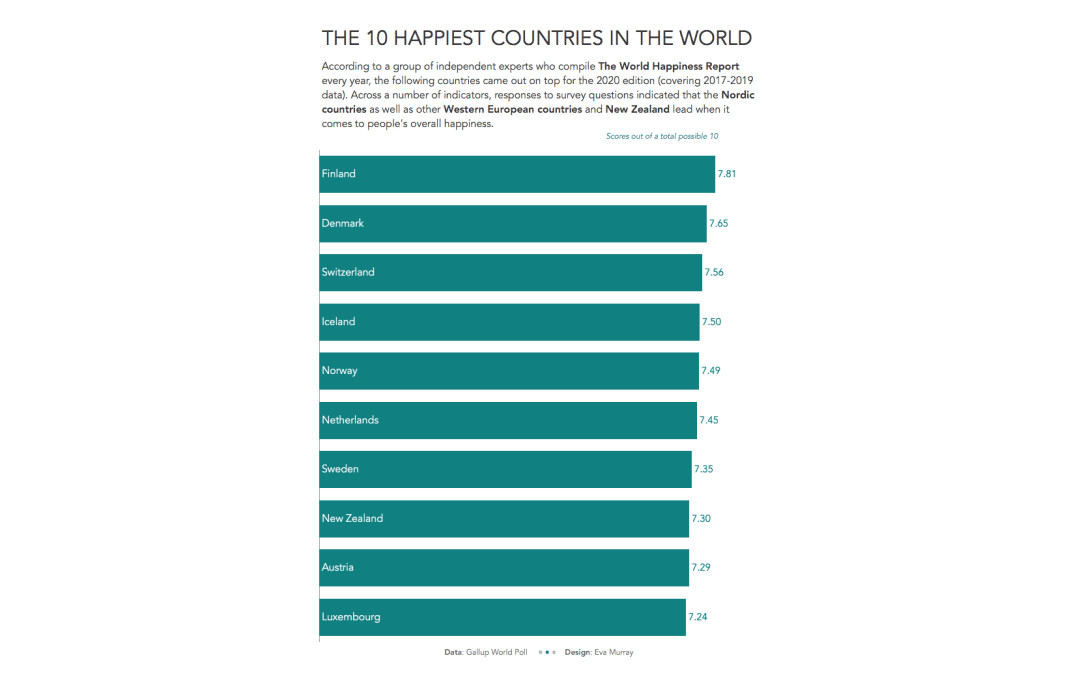
by Eva Murray | May 13, 2020 | Makeover Monday, Tableau
This week we’re looking at the World Happiness Report 2020, which lists over 150 countries in order of their reported happiness, based on a survey conducted by Gallup. This is the viz:...
by Eva Murray | Mar 29, 2020 | Tableau
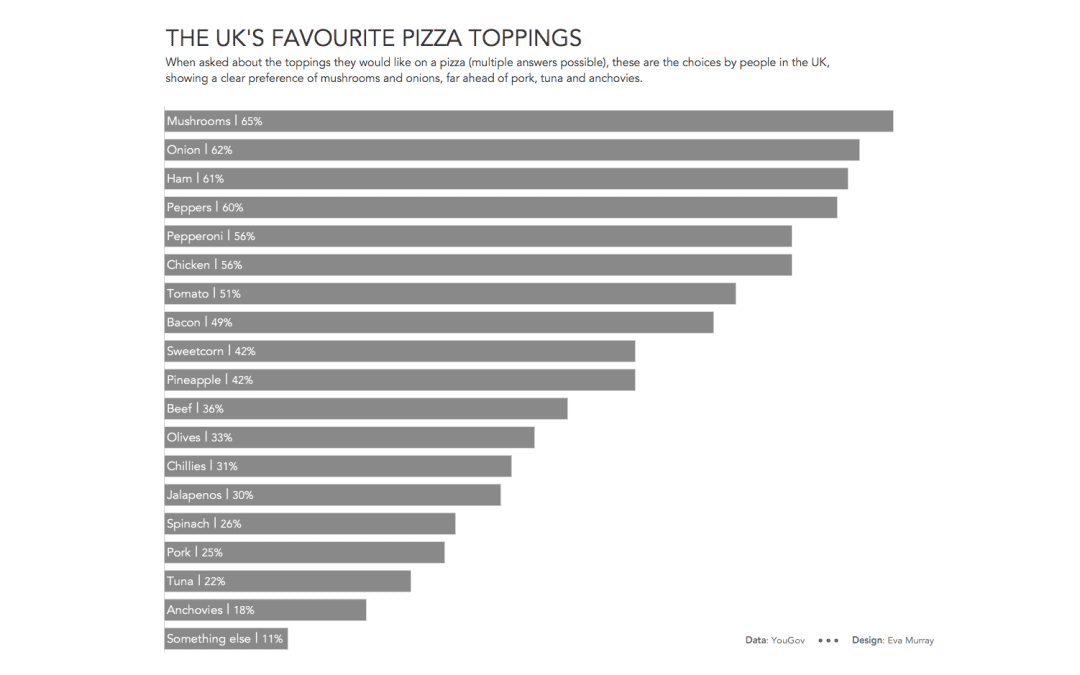
I’m pretty partial to food topics and this week Charlie chose an ‘excellent’ viz very much in need of a makeover, showing people’s favourite pizza toppings. The data behind it is nice and simple, so this week, rather than delaying my viz...