by Eva Murray | Feb 10, 2019 | Tableau
The president of the United States is a never ending source of news and analysis-worthy headlines. The recent leak of Trump’s daily schedule provided us with a nice dataset to work with for Makeover Monday and there was no hesitation to use it for this...
by Eva Murray | Feb 3, 2019 | Tableau
One of the fun aspects of #MakeoverMonday is to pick a dataset each week. When I don’t have something obvious in mind or haven’t looked at the ‘backlog’ of options yet, I tend to check the calendar for significant events that we could viz...
by Eva Murray | Jan 28, 2019 | Tableau
For week 5 we use data from the European Commission about the Digital Economy and Society Index, measuring digital performance for European countries. The original viz looks like this: What works well: Countries are sorted in descending order from highest to lowest...
by Eva Murray | Jan 21, 2019 | Tableau
I enjoy stumbling across interesting datasets and visualisations and this week that takes us to London, more specifically to 10 Downing St where the Prime Minister lives. The data contains electricity usage for the year 2017 and the original viz from Carbon Culture...

by Eva Murray | Jan 12, 2019 | Tableau
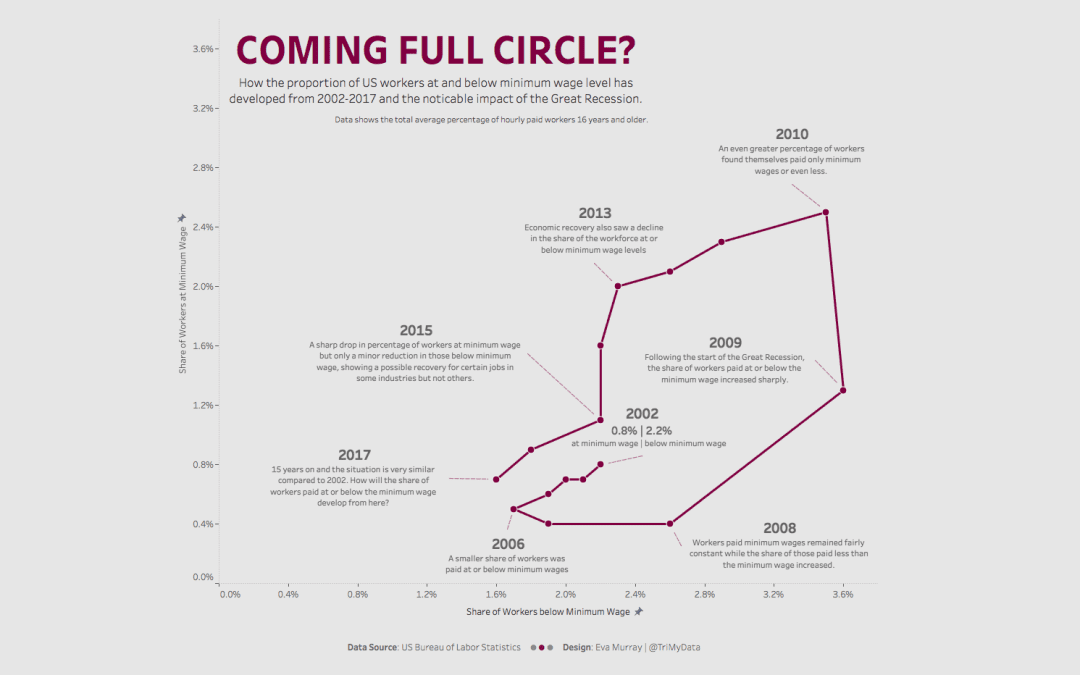
Week 3 is upon us and we’re moving from Freedom of the Press to minimum wages in the US. The viz to makeover this week is the following map showing for each stage the percentage of workers earning the minimum wage or less. What works well: A map is often a viz...