by Eva Murray | Feb 17, 2019 | Makeover Monday, Tableau
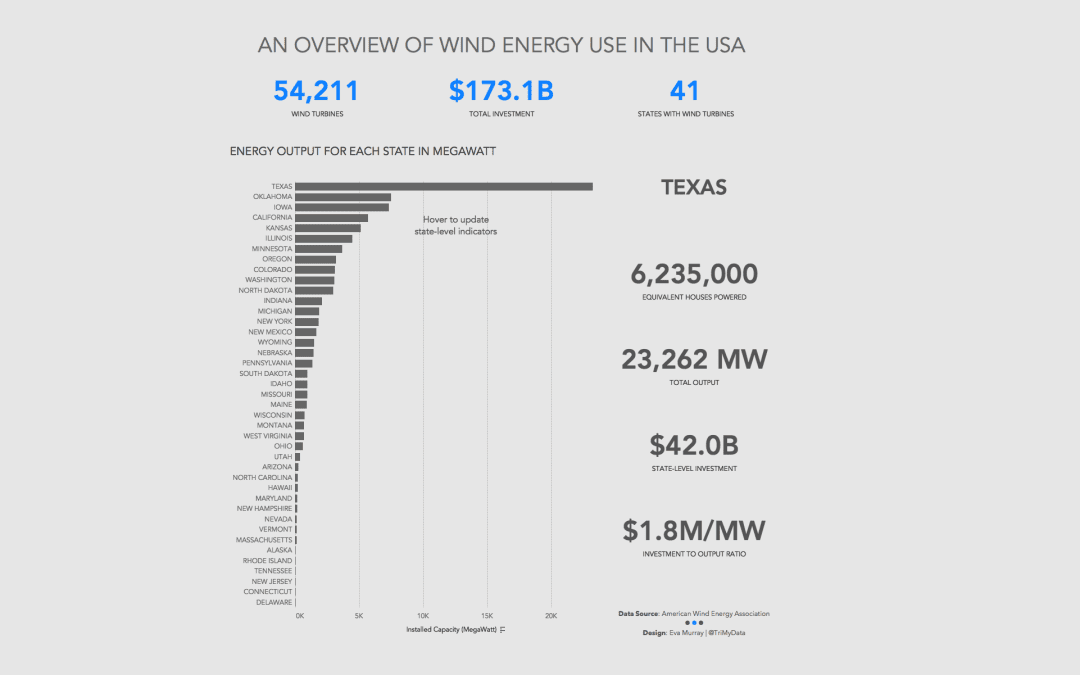
This week we look at how much wind energy is produced in different US states. The original viz (and awfully opinionated, anti-wind energy article) comes from howmuch.net: What works well: States are sorted in descending order from highest to lowest installed capacity...