by Eva Murray | Jan 21, 2021 | Makeover Monday, Tableau
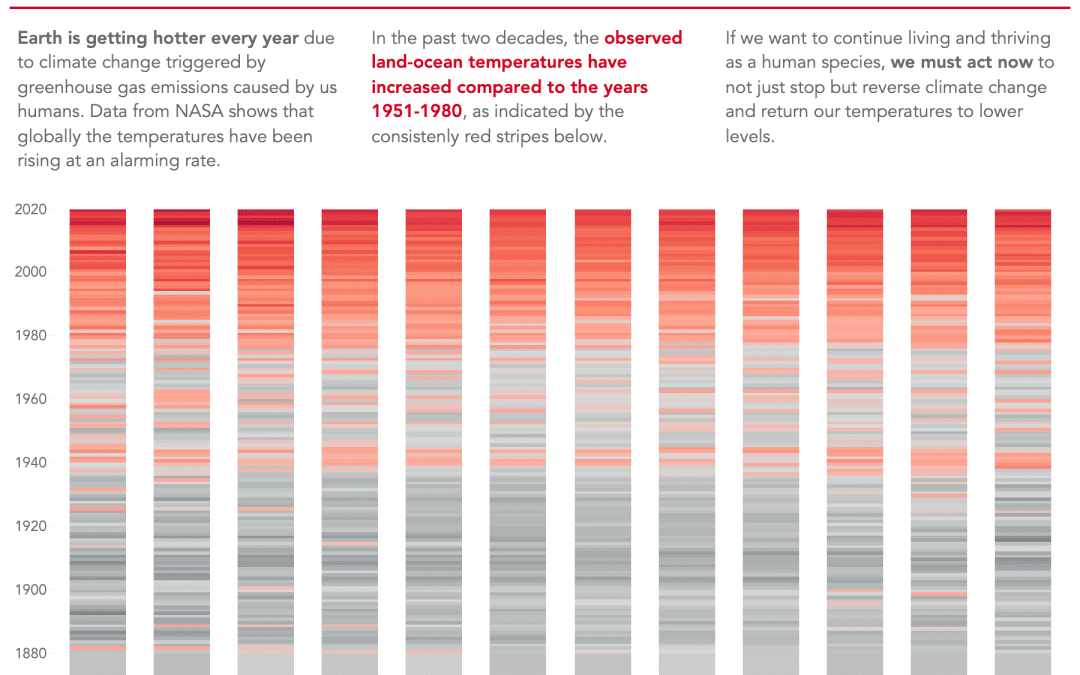
For this week Andy chose a dataset about global warming, a topic that has been largely ignored in the media during 2020 as everyone’s focus shifted to the COVID pandemic. But here we are, getting closer and closer to the point where irreparable damages will be...
by Eva Murray | Dec 28, 2020 | Makeover Monday, Tableau
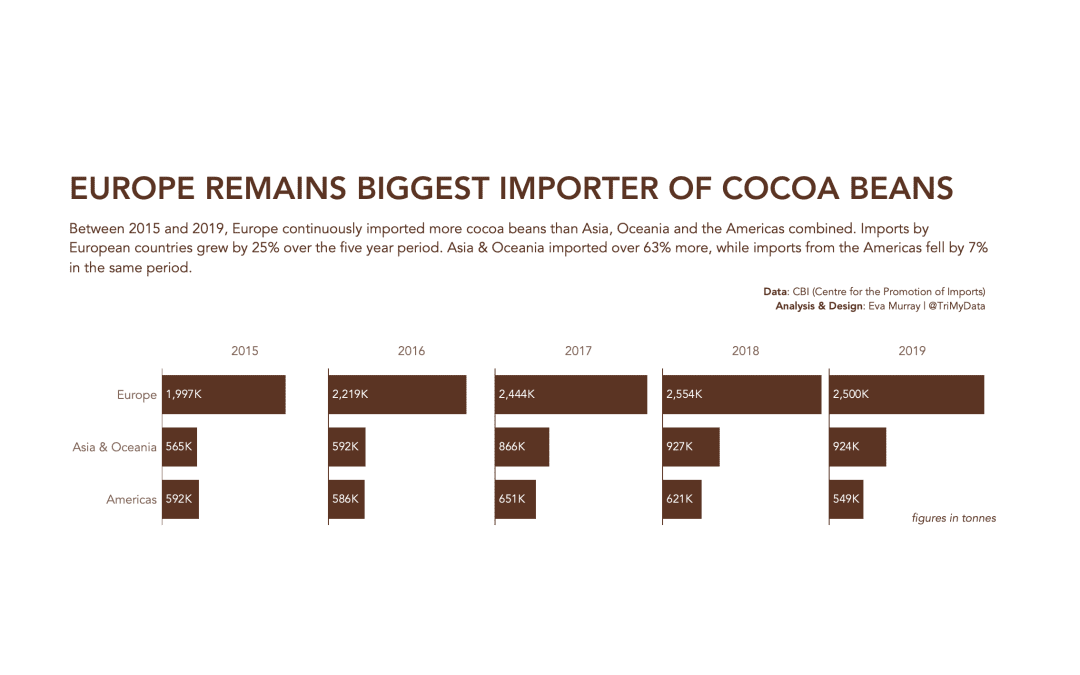
This has to be quick. 2020 somehow still hasn’t finished and this Monday has been dragging on for what feels like 40 hours now. Let’s make it a bar chart to end the year. But first: Here is the original viz, looking at cocoa import stats for regions across...
by Eva Murray | Nov 16, 2020 | Makeover Monday, Tableau
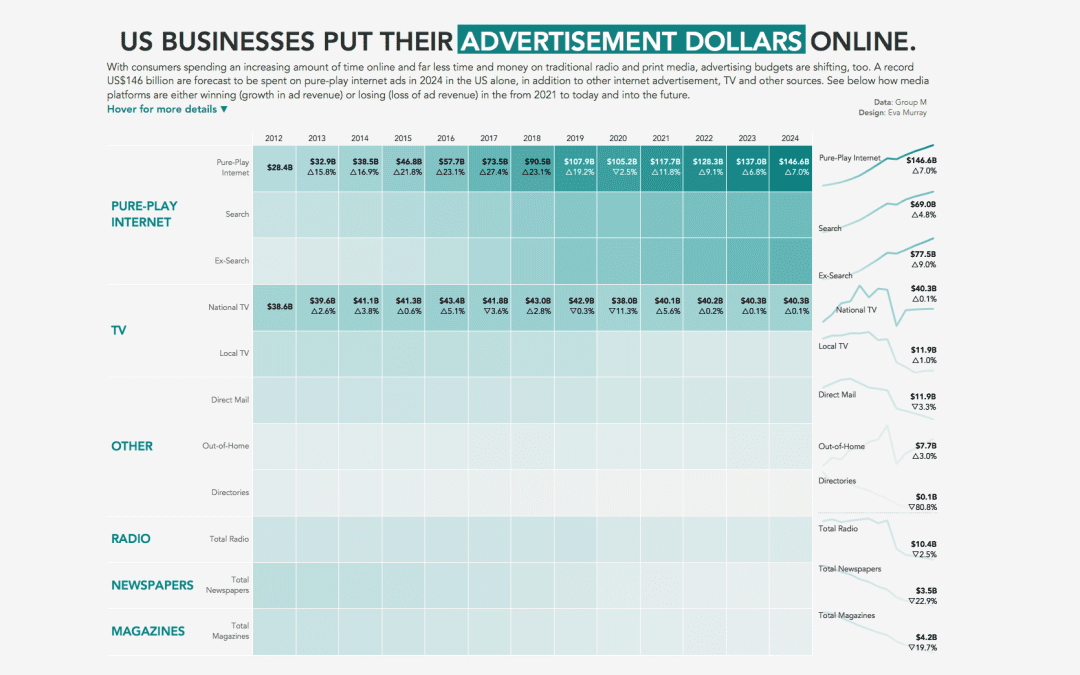
Andy found a great viz for this week’s #MakeoverMonday challenge and kindly dug out the data for me as well as I’m managing a few different projects at the same time. This week we’re looking at advertising spend in the US with the original viz...
by Eva Murray | Oct 30, 2020 | Tableau
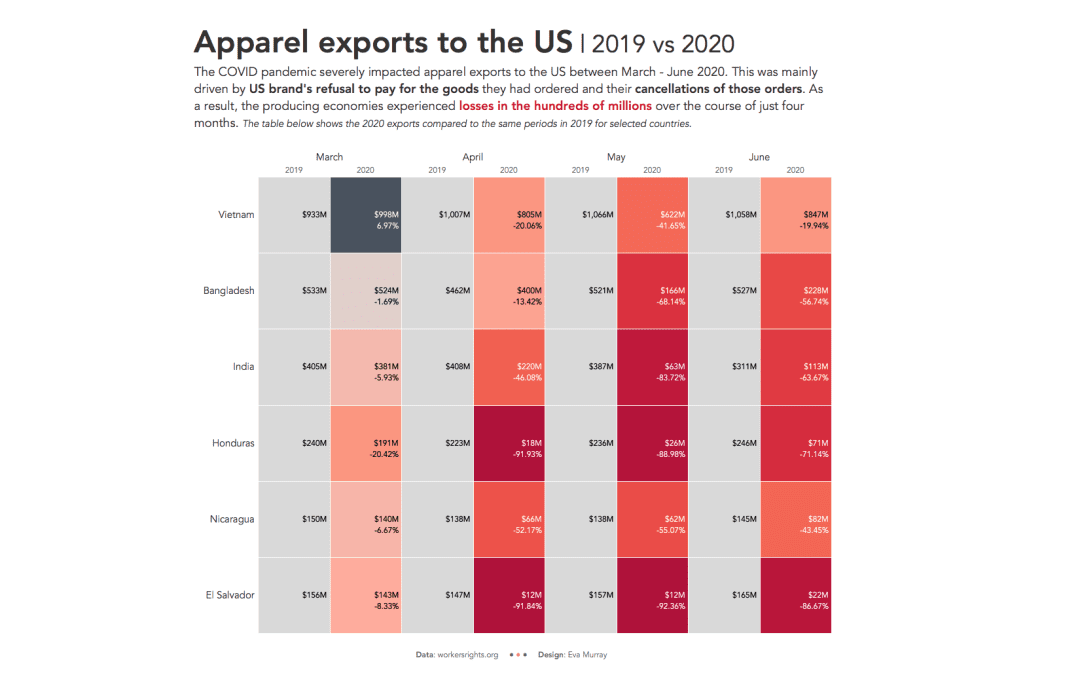
For this week’s #MakeoverMonday, Charlie chose a dataset about the unpaid apparel orders by US brands from their producers, resulting in severe detrimental impacts on workers rights and businesses. This is the original visualization:...
by Eva Murray | Oct 20, 2020 | Makeover Monday, Tableau
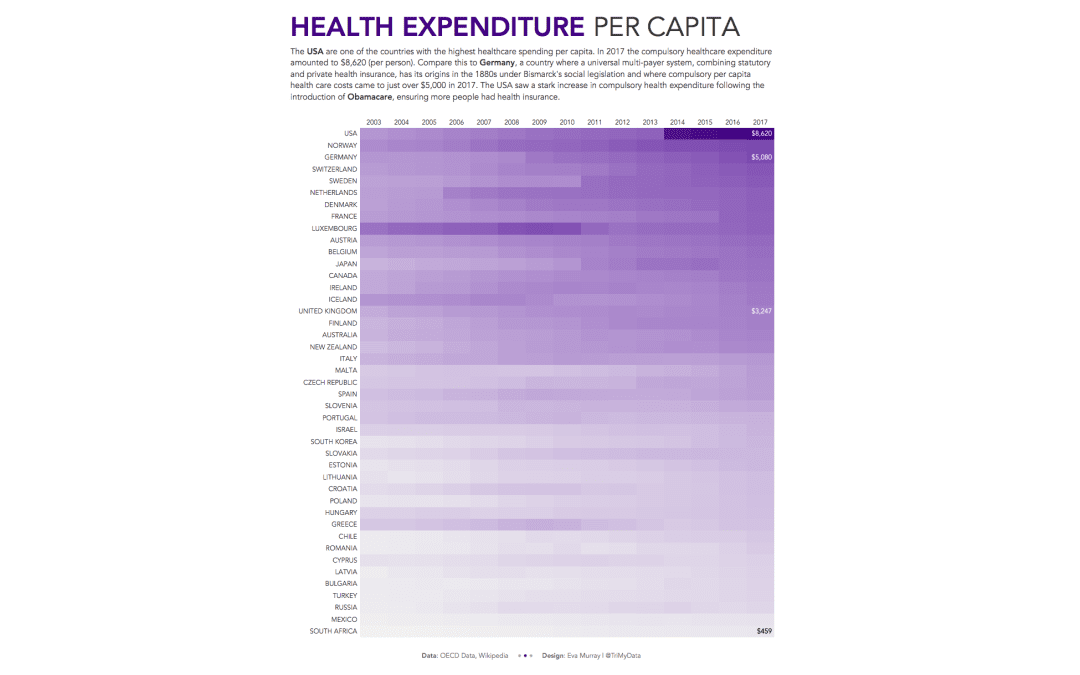
A quick viz this week and a quick blog, looking at health spending per capita in different countries. I’ll admit, I wanted to do a heat map before even looking at the data, so a heat map it is. This week we’re looking at OECD data about healthcare...