by Eva Murray | Apr 22, 2019 | Tableau
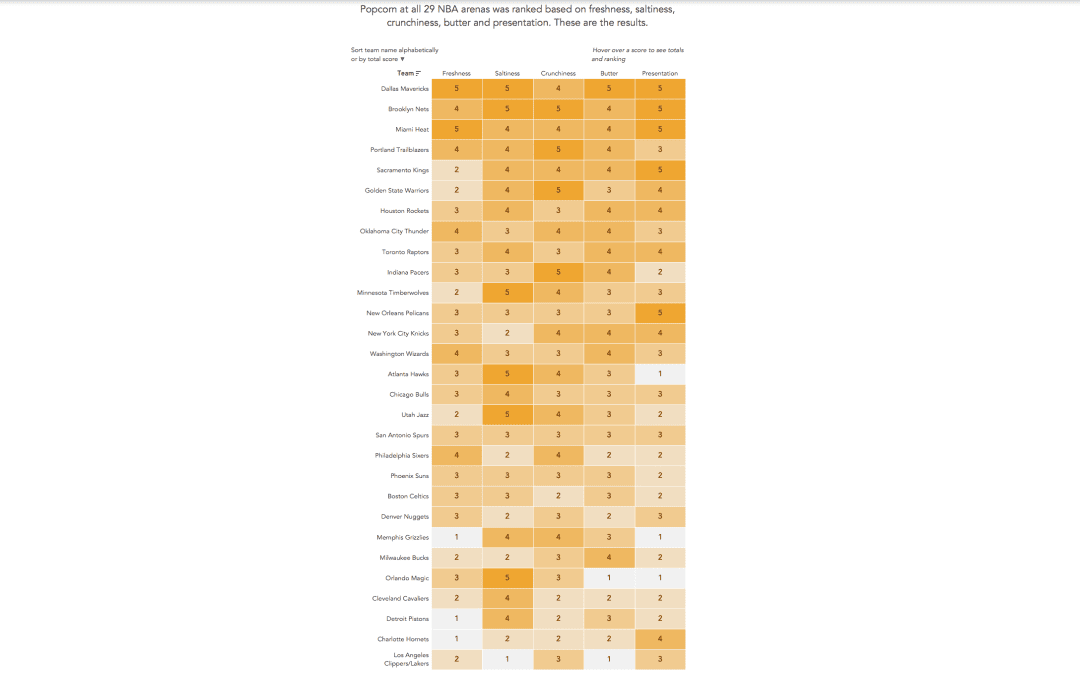
Andy found a great dataset for this week’s challenge: rankings of stadium popcorn at NBA stadiums across the US. It’s in an article by the New York Times and here is the viz itself: What works well: It’s a great viz of the ranking with clear labels...


