by Eva Murray | Apr 17, 2021 | Makeover Monday
My viz for this week
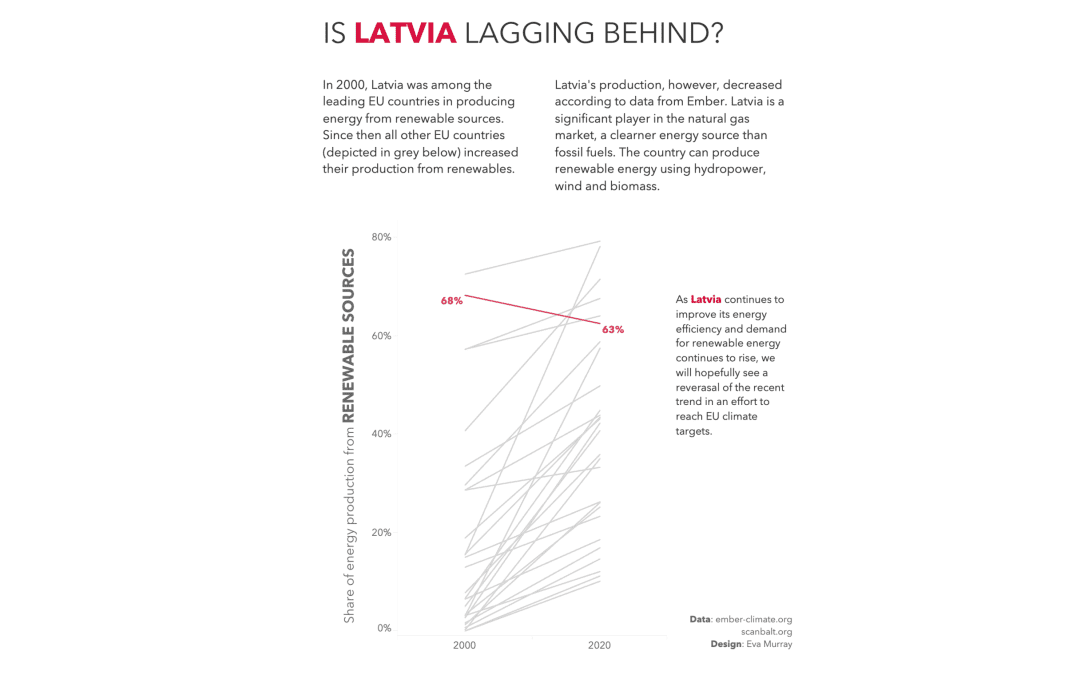
by Eva Murray | Feb 4, 2021 | Makeover Monday, Tableau
We’re sticking with the energy theme this week and look at renewable versus fossil fuel production in EU countries. The original visualisation comes from the EU Power Sector 2020 report from ember-climate.org: What works well: The title connects well to the...
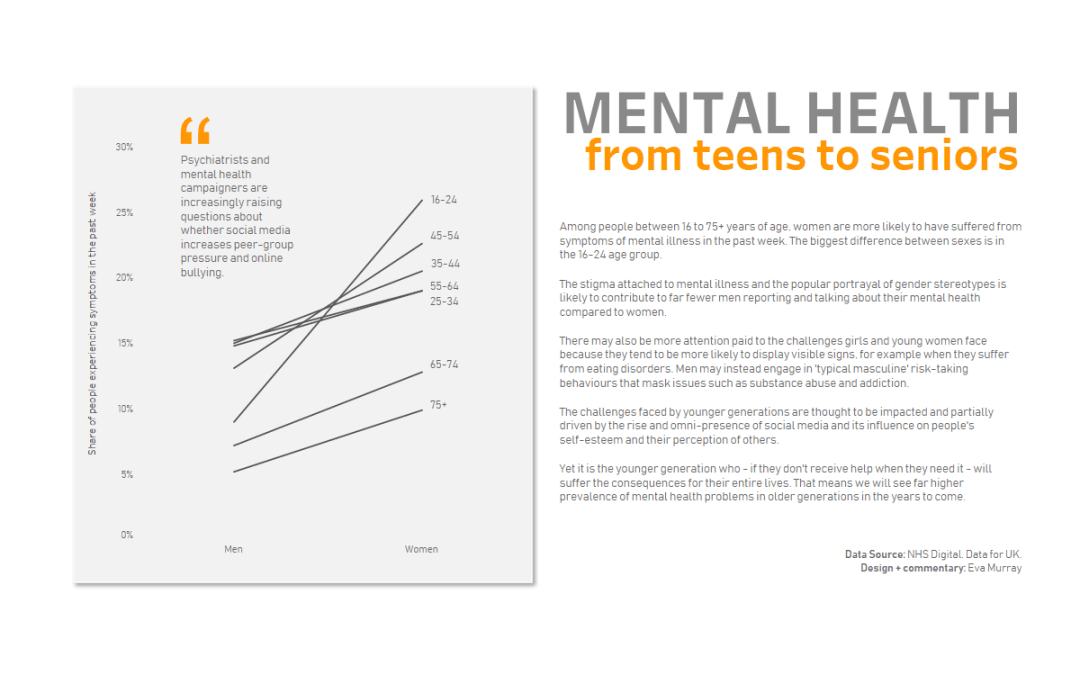
by Eva Murray | Jul 7, 2020 | Makeover Monday, Tableau
For this week’s #MakeoverMonday, Charlie chose a chart from a BBC article about the prevalence of mental health issues between men and women and across different age groups. Here is the original viz:...
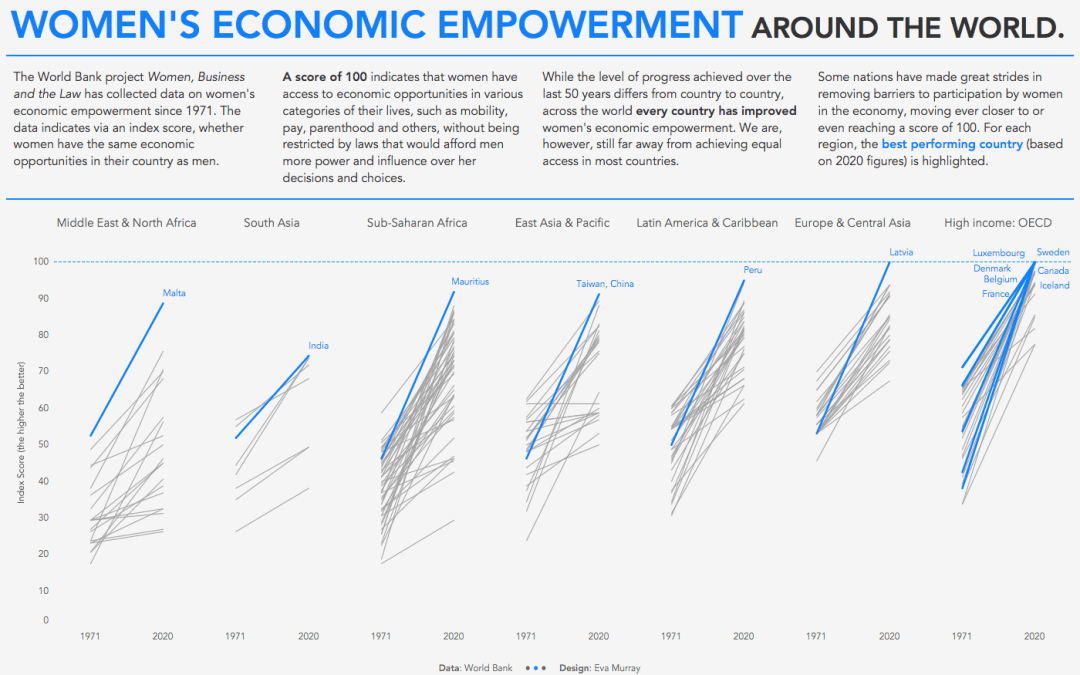
by Eva Murray | Jul 3, 2020 | Makeover Monday, Tableau
For this year’s #Viz5 (Visualize Gender Equality) initiative we get a monthly data challenge from the team at Operation Fistula. This week the topic they selected is women’s economic empowerment, with a massive dataset of 50 years of country-level data...
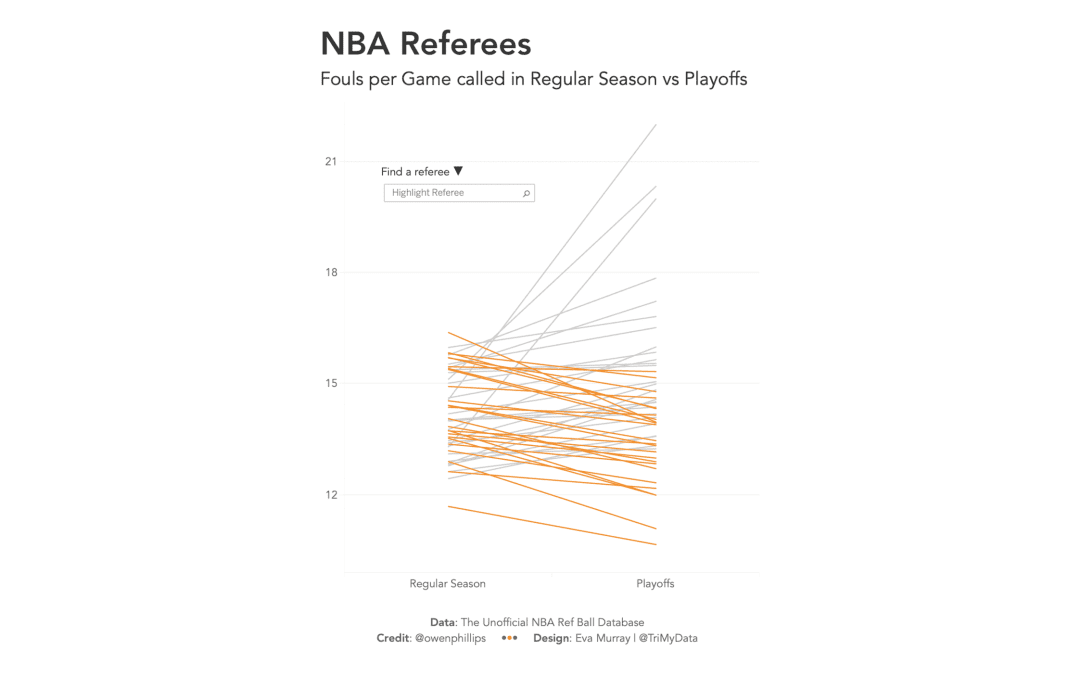
by Eva Murray | Nov 18, 2019 | Tableau
Given the buzz of #data19 last week, we’re working with a small and simple dataset for week 47, so we can all have some extra time to catch up on the things we missed at home. Here is the original viz: What works well: The colors draw my attention. The line...