by Eva Murray | Feb 13, 2021 | Makeover Monday, Tableau
This week we’re visualizing another #Viz5 dataset, this time about perceived obstacles to Gender Equality. The original viz is this: What works well: Detailed description Detailed results What could be improved: While details can be helpful, in this case I find...
by Eva Murray | Jan 11, 2021 | Makeover Monday, Tableau
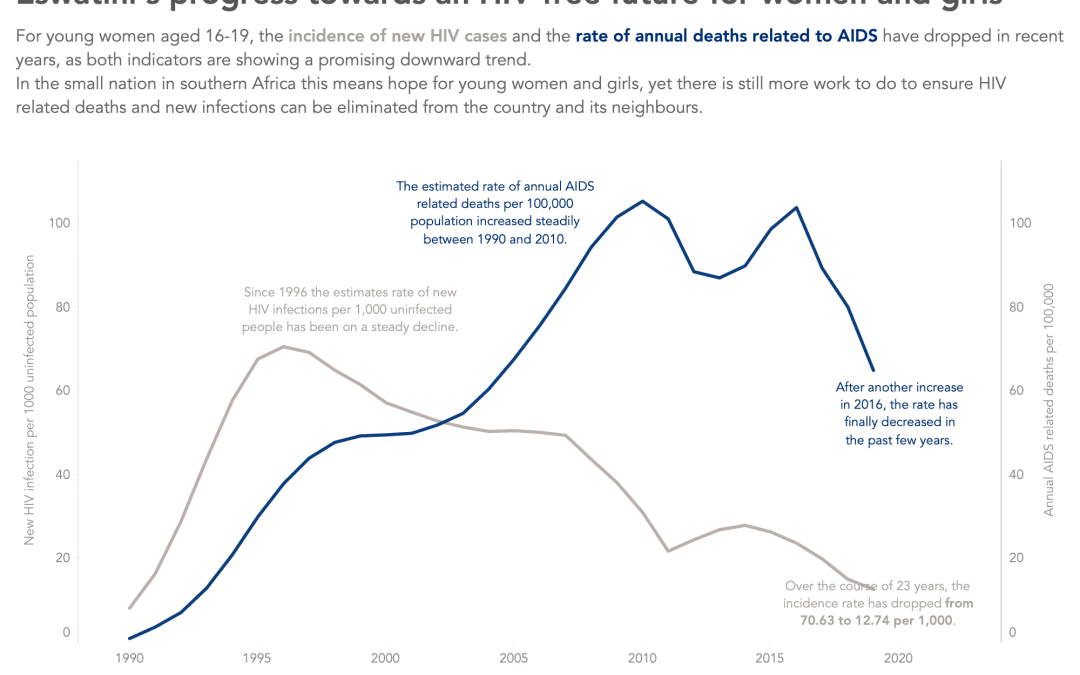
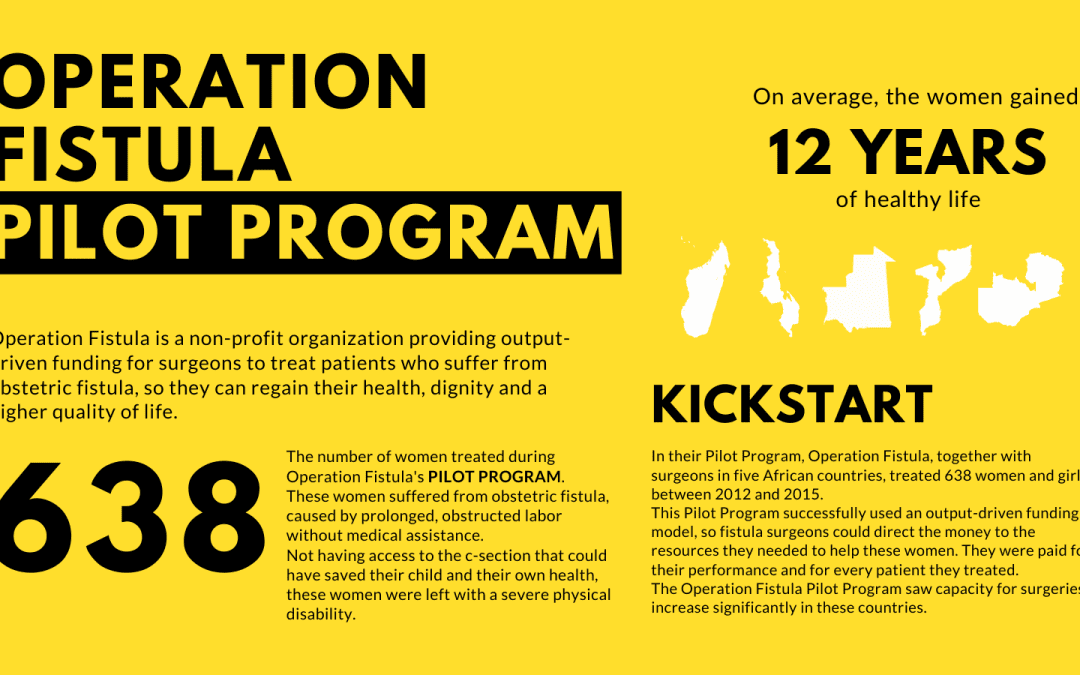
This week we’re tackling another Viz5 dataset to highlight gender inequality in new HIV infections among adolescents. The data comes from UNICEF and was provided to us by Operation Fistula who also created the original visualization: What works well: Key metrics...
by Eva Murray | Dec 2, 2020 | Makeover Monday, Tableau
This week is another #viz5 challenge and I love seeing everyone’s work come in all throughout the week. My vizzes for #Viz5 always take a bit longer because I want to get them right and today I got the chance to do my analysis while munching my lunch, and to...
by Eva Murray | Oct 1, 2020 | Tableau
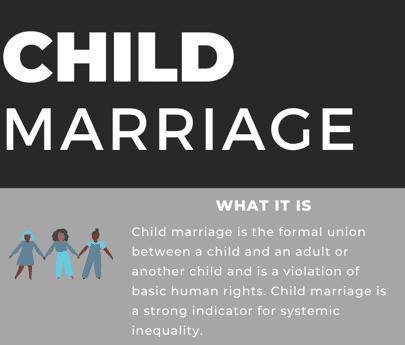
Yes, it’s time to tackle another #Viz5 topic and this time, much like previously, it’s another punchy theme. We’re analyzing child marriage and the percentages of underaged girls and boys being married to adults. The data for this week’s...
by Eva Murray | Jul 28, 2020 | Tableau
This week sees us tackle another #Viz5 dataset, focusing on a gender equality topic: women in power, i.e. the parliamentary representation of women. The dataset comes from the World Bank and the team at Operation Fistula created a visualization for us to use as a...