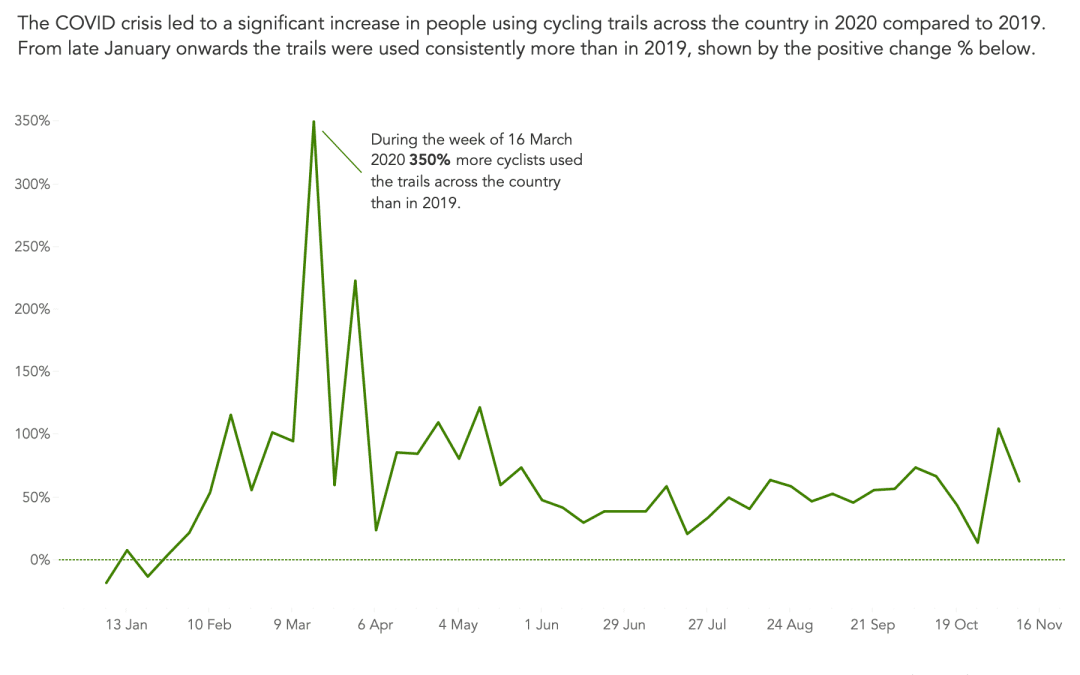
by Eva Murray | Jan 5, 2021 | Tableau
Finally it’s 2021 and I have to say, I am very excited about this year. 2020 was more challenging and draining than I first thought, so I’m looking ahead to a year that will hopefully be less stressful and more social. As we turn over the calendar to 2021,...
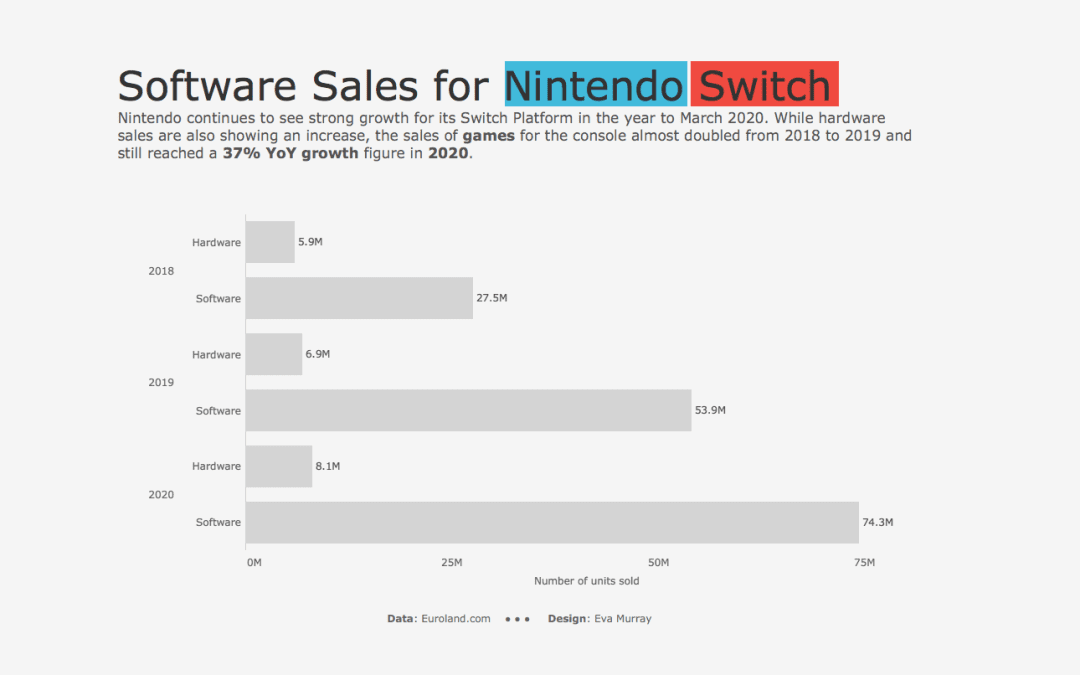
by Eva Murray | Nov 13, 2020 | Tableau
It’s already the end of the week and what a week it’s been. Life is pretty full at the moment, so I’m challenging myself to a very quick and time-boxed #MakeoverMonday this week. We’re looking at Video Game Sales Units with the original viz...
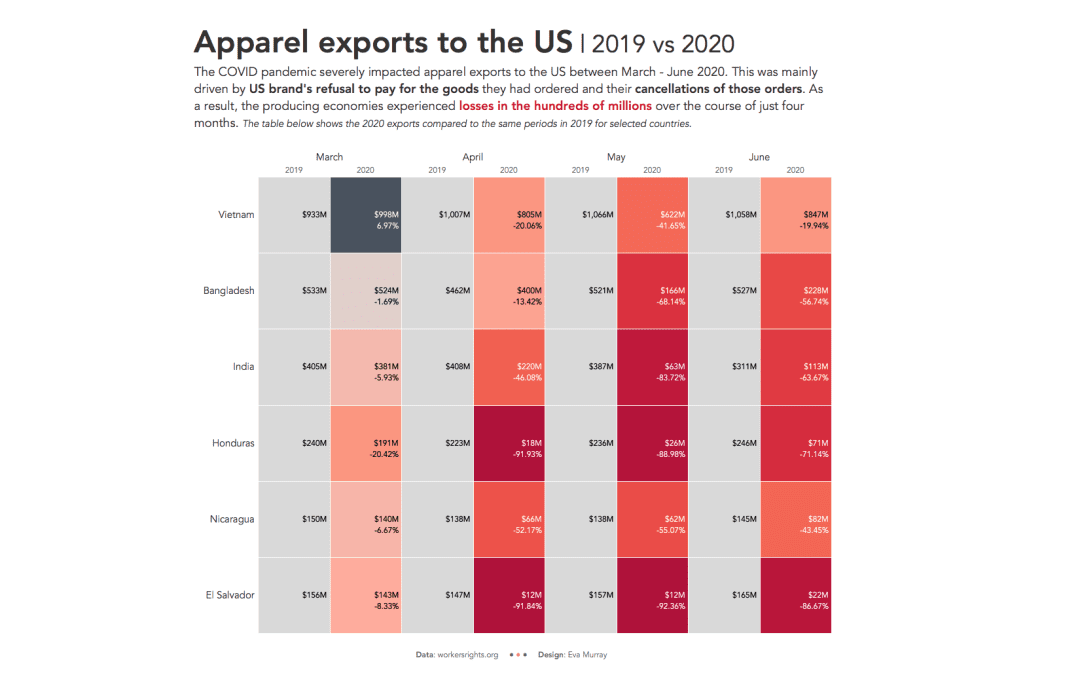
by Eva Murray | Oct 30, 2020 | Tableau
For this week’s #MakeoverMonday, Charlie chose a dataset about the unpaid apparel orders by US brands from their producers, resulting in severe detrimental impacts on workers rights and businesses. This is the original visualization:...
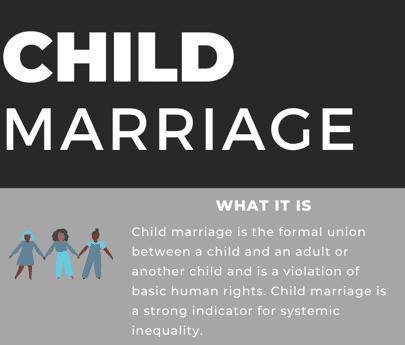
by Eva Murray | Oct 1, 2020 | Tableau
Yes, it’s time to tackle another #Viz5 topic and this time, much like previously, it’s another punchy theme. We’re analyzing child marriage and the percentages of underaged girls and boys being married to adults. The data for this week’s...
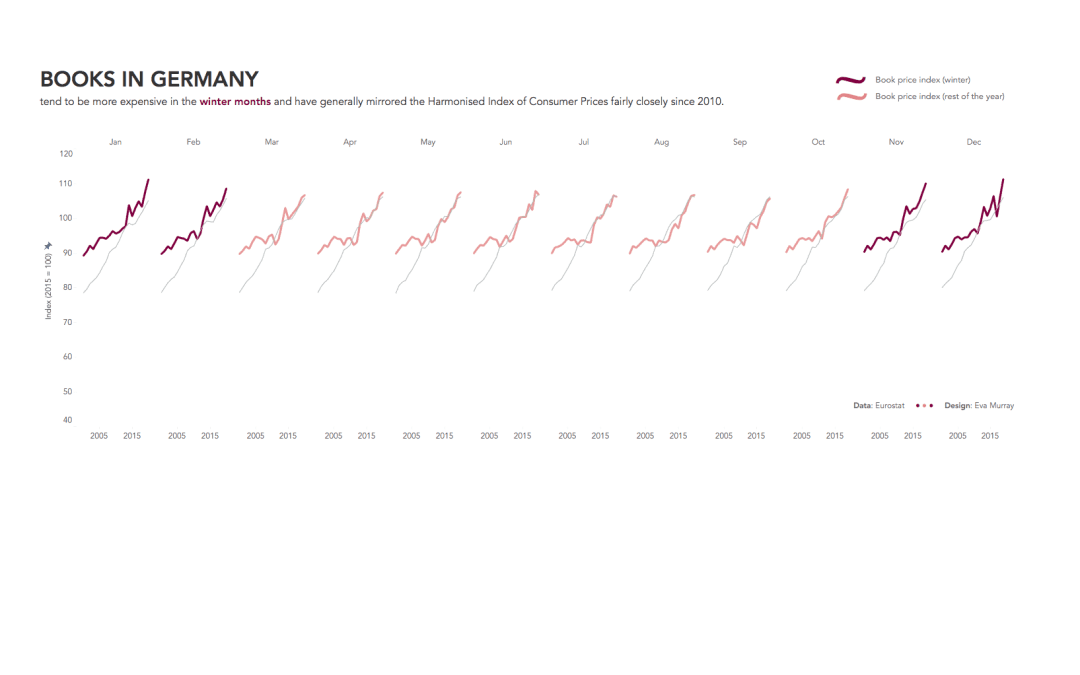
by Eva Murray | Sep 22, 2020 | Tableau
We haven’t used time series data in MM for a while, so I was pleased to find a dataset that combined several years of data at the month level with a topic I love: books and reading. The original visualization comes from Eurostat...