by Eva Murray | Sep 22, 2020 | Tableau
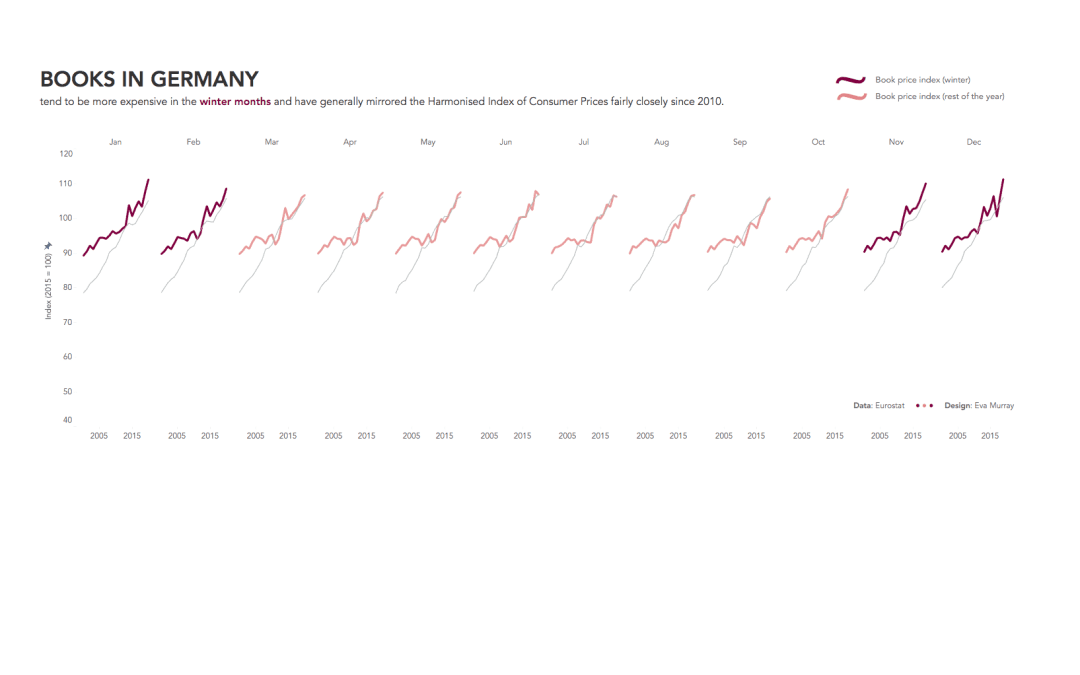
We haven’t used time series data in MM for a while, so I was pleased to find a dataset that combined several years of data at the month level with a topic I love: books and reading. The original visualization comes from Eurostat...