by Eva Murray | Sep 22, 2020 | Tableau
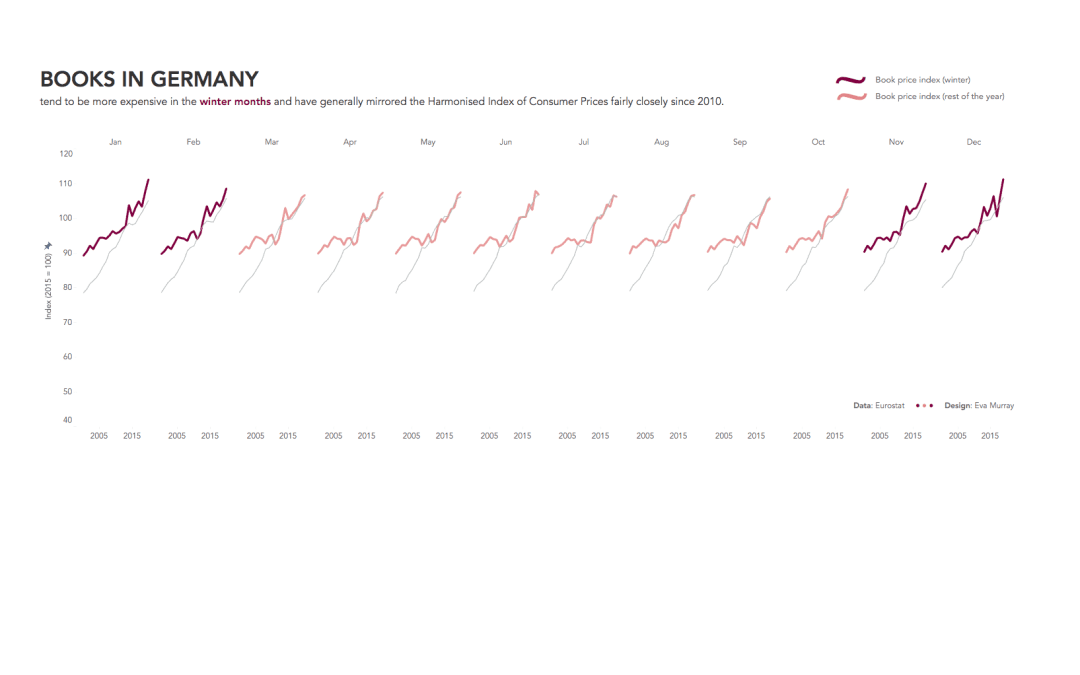
We haven’t used time series data in MM for a while, so I was pleased to find a dataset that combined several years of data at the month level with a topic I love: books and reading. The original visualization comes from Eurostat...
by Eva Murray | Sep 18, 2020 | Makeover Monday, Tableau
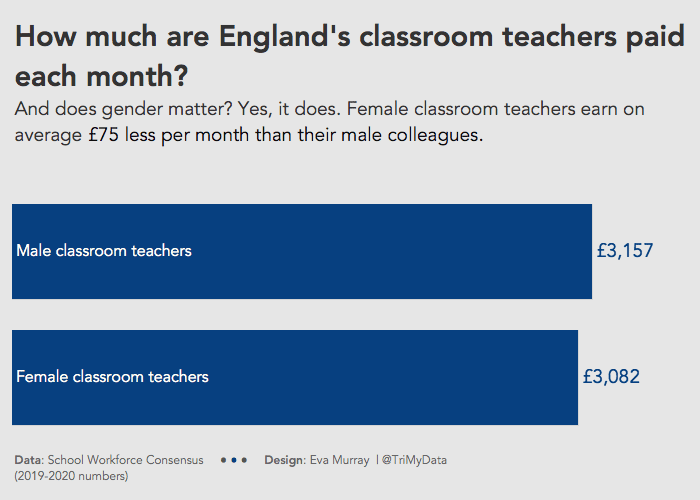
This week has to be quick because I’m official on holidays and it’s so sunny outside that it would be criminal to spend too much time in front of a screen. Charlie selected a dataset about teacher salaries in England. I saw a lot of cool visualizations...