by Eva Murray | Dec 28, 2020 | Makeover Monday, Tableau
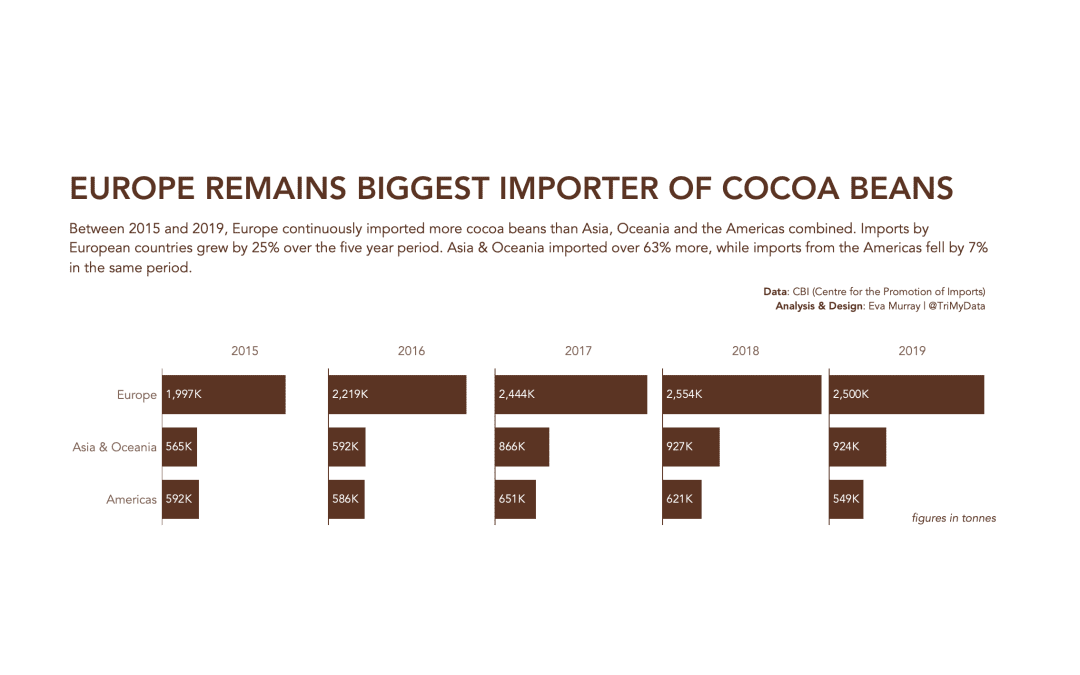
This has to be quick. 2020 somehow still hasn’t finished and this Monday has been dragging on for what feels like 40 hours now. Let’s make it a bar chart to end the year. But first: Here is the original viz, looking at cocoa import stats for regions across...