by Eva Murray | Jun 4, 2018 | Tableau
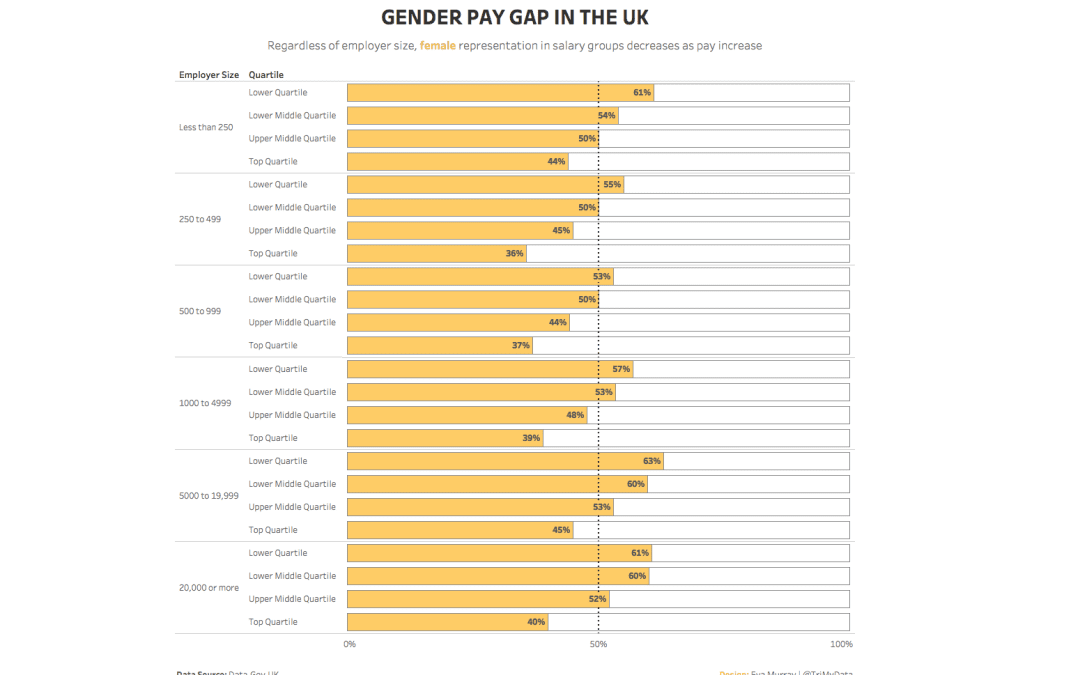
What a tough dataset Andy picked for this week. As much as I enjoy a good dig around the data, I do value my sleep and I’m missing out because I’m trying to make sense of this data.With a topic like the gender pay gap, it’s not like I’m happy...
by Eva Murray | May 28, 2018 | Tableau
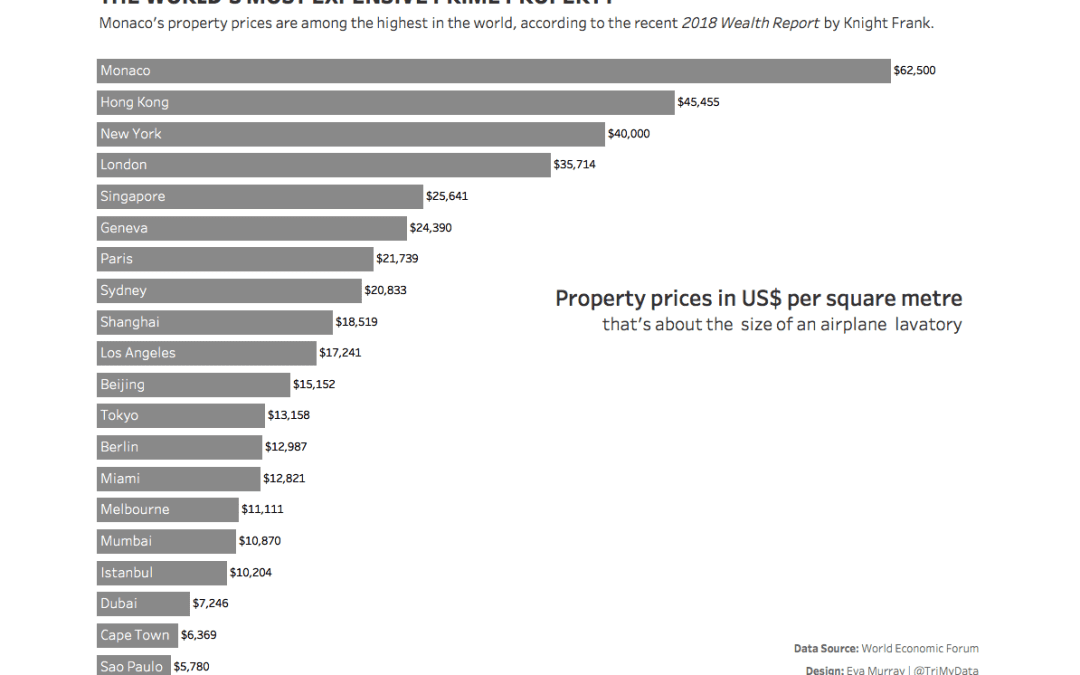
A couple of weeks ago, Sarah Bartlett shared a link to the viz we’re using for this week’s makeover.What’s great is that the dataset is very simple, one dimension and one measure.No doubt there will be richer datasets in the future but what Andy and...
by Eva Murray | May 14, 2018 | Tableau
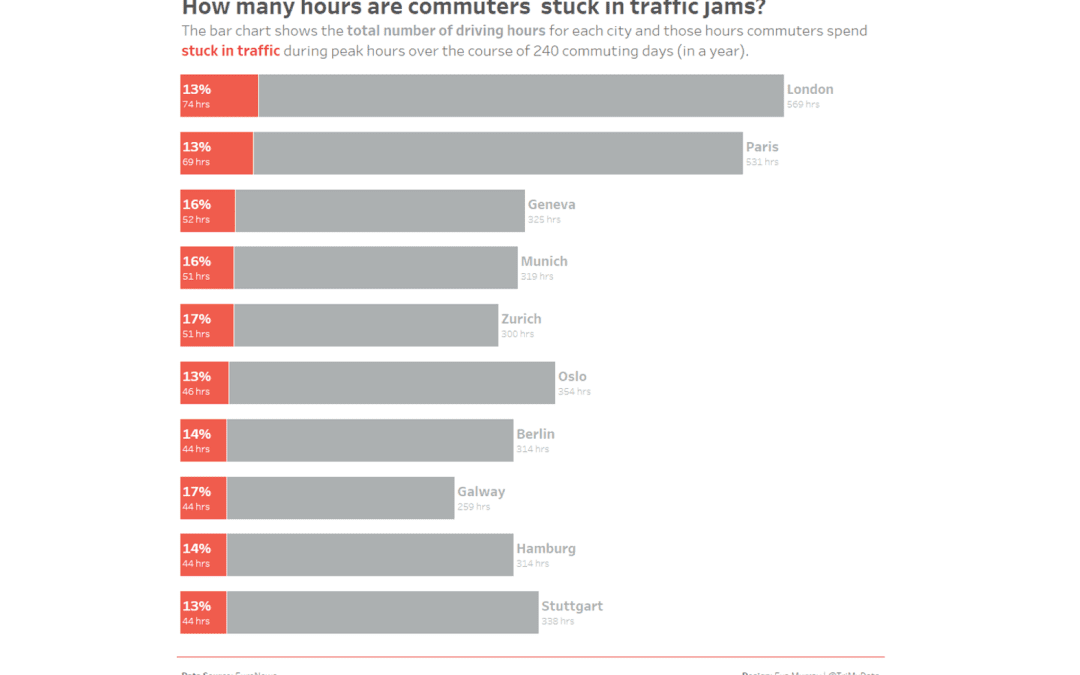
Traffic jams are an unpleasant side effect of living in cities and driving cars. After my move to Nuremberg last August, my commute changed significantly. Instead of a frustrating 60min drive each way, I now spend a pleasant 12-14 minutes riding my city cruiser bike...
by Eva Murray | Apr 30, 2018 | Tableau
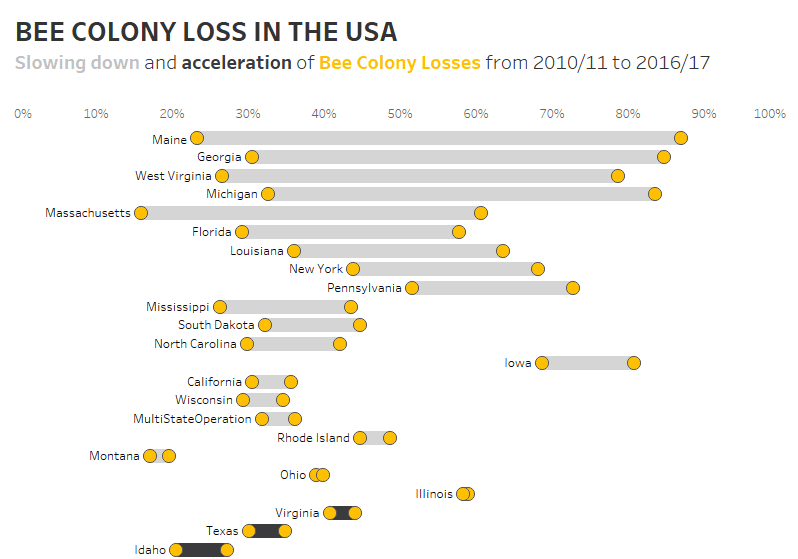
Following on from last week’s ecological footprint dataset, in week 18 we are tackling the very important and topical issue of Bee Colony Loss.There is a lot of debate about this in the media and the discussion ranges from pesticides, fertilizers, cell pone...