by Eva Murray | Nov 26, 2018 | Tableau
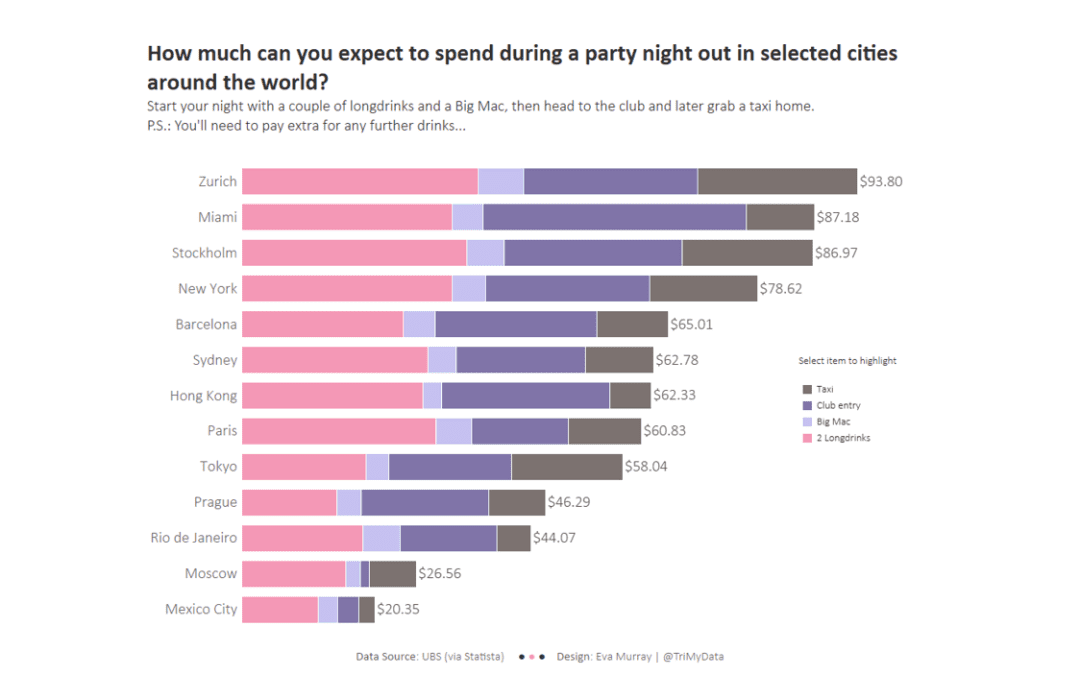
As we head into ‘silly season’ and are only a few days away from December with all its Christmas parties, having a look at the cost of a night out in different cities around the world gives us an appreciation for how much a bit of entertainment will set...
by Eva Murray | Aug 26, 2018 | Tableau
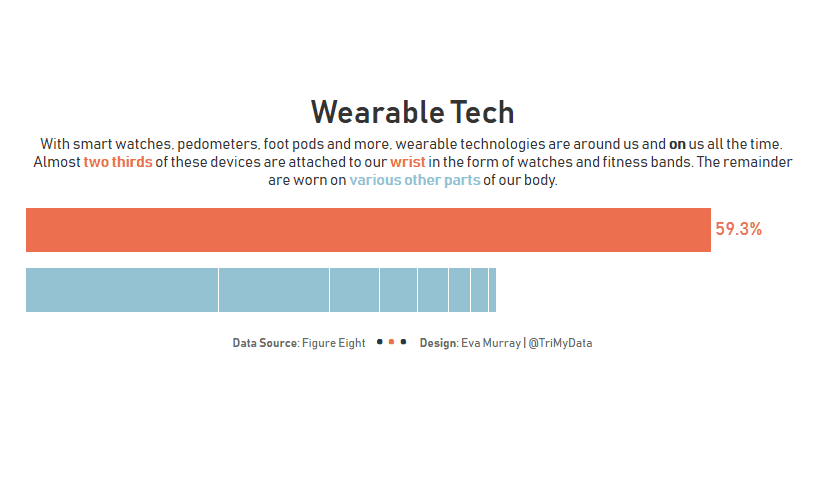
Thanks Andy for making it easy for us this week with a simple bar chart to make over, looking at wearable technology and which body part we attach devices to.Here is the original: What works well: Sorted in descending order from most common to least common location...