by Eva Murray | Nov 26, 2018 | Tableau
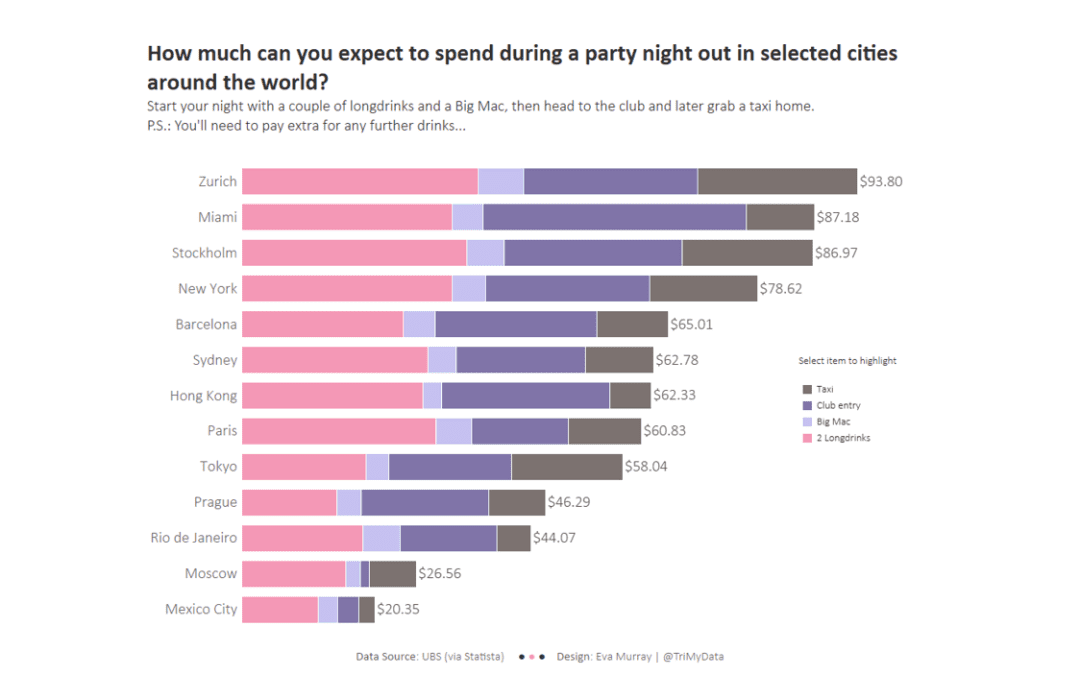
As we head into ‘silly season’ and are only a few days away from December with all its Christmas parties, having a look at the cost of a night out in different cities around the world gives us an appreciation for how much a bit of entertainment will set...
by Eva Murray | Nov 11, 2018 | Makeover Monday, Tableau
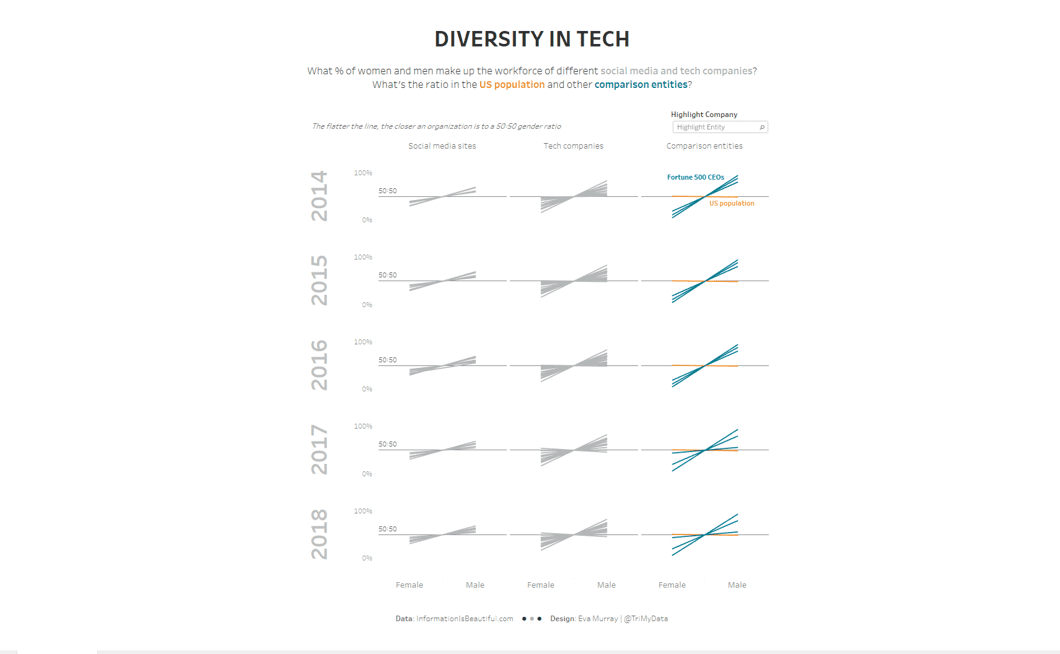
Diversity, particularly gender diversity, in business has been a hot topic for the past few years and is something we shouldn’t stop talking about until we’ve made some progress.This week’s Makeover Monday dataset looks at the makeup of workforce of...
by Eva Murray | Oct 29, 2018 | Tableau
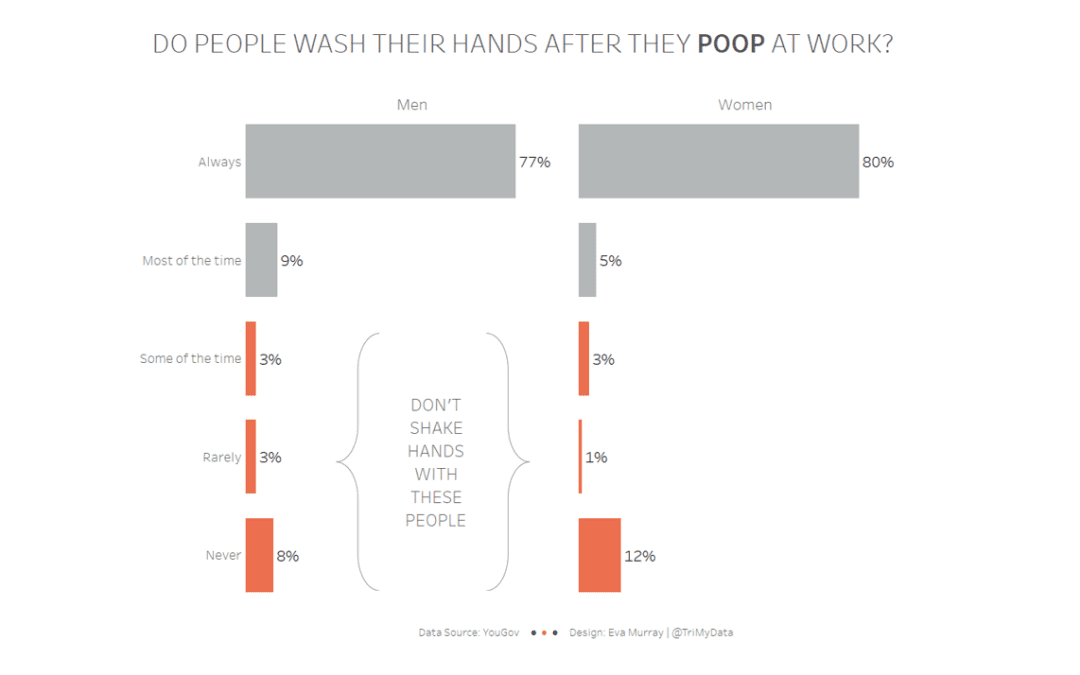
Tackling this Makeover Monday dataset in a slightly zombie state while waiting for my connection from London to Frankfurt as I fly home from TC18 in New Orleans…And then there is a dataset about poo. Who would have thought? But sometimes we need something as...
by Eva Murray | Sep 24, 2018 | Tableau
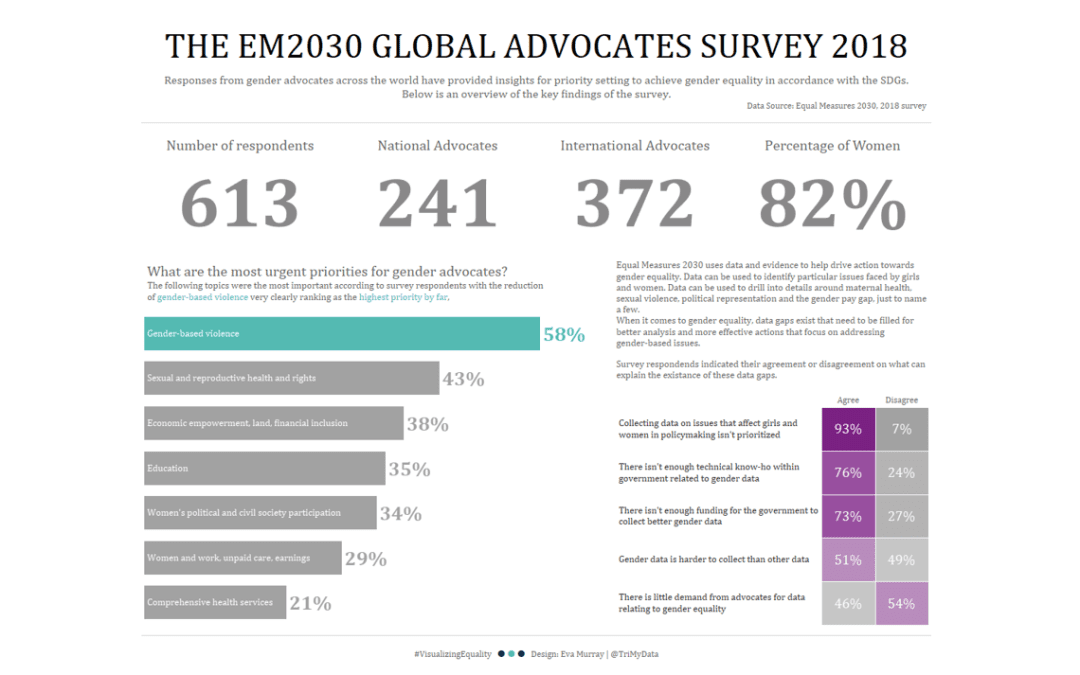
Collaborations for Makeover Monday mean that we partner with a non-profit organization to help them crowd-source visualizations that support their mission and help them create awareness through data and analysis.This week we’re collaborating with Equal Measures...
by Eva Murray | Aug 26, 2018 | Tableau
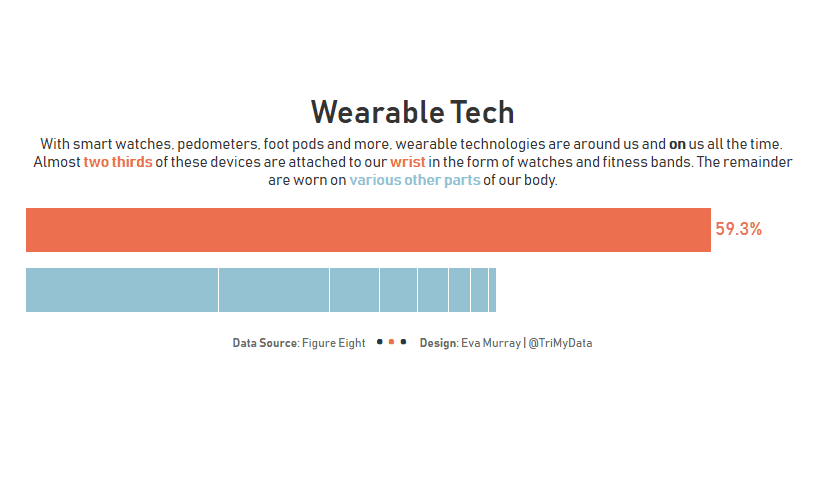
Thanks Andy for making it easy for us this week with a simple bar chart to make over, looking at wearable technology and which body part we attach devices to.Here is the original: What works well: Sorted in descending order from most common to least common location...