by Eva Murray | Feb 3, 2019 | Tableau
One of the fun aspects of #MakeoverMonday is to pick a dataset each week. When I don’t have something obvious in mind or haven’t looked at the ‘backlog’ of options yet, I tend to check the calendar for significant events that we could viz...
by Eva Murray | Jan 28, 2019 | Tableau
For week 5 we use data from the European Commission about the Digital Economy and Society Index, measuring digital performance for European countries. The original viz looks like this: What works well: Countries are sorted in descending order from highest to lowest...
by Eva Murray | Dec 30, 2018 | Tableau
And here we go again. Week 1 once more, now my third ‘week 1’ as a co-host of #MakeoverMonday. I’m very excited about the year ahead, finding new datasets and dataviz challenges for our community. Andy picked a dataset about NHL attendance, i.e. how...

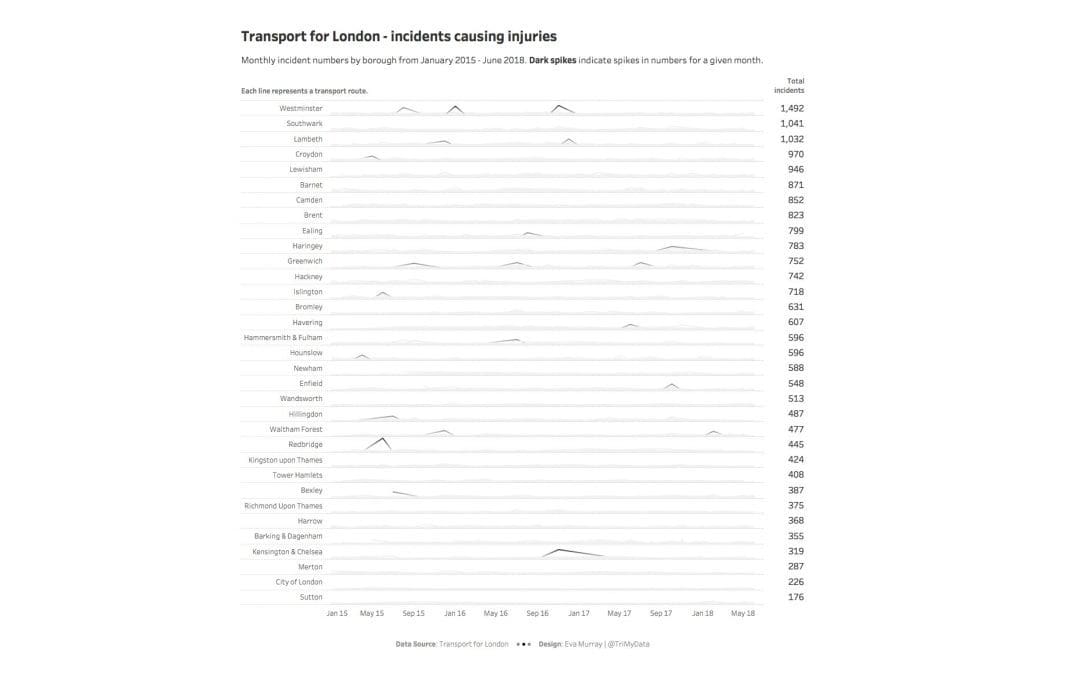
by Eva Murray | Dec 17, 2018 | Makeover Monday, Tableau
In September this year, Andy was hit by a bus while out on a ride. I had a few close calls myself over the years with cars, buses and trucks. Especially in Australia, where many drivers sadly treat cyclists like cockroaches. But even in Germany, a country where most...
by Eva Murray | Dec 10, 2018 | Makeover Monday, Tableau
It is week 50 already and where has this year gone? The 50th week of Makeover Monday in 2018 and another opportunity to improve the way we visualize and analyze data. This week we’re looking at the land use for producing different food types. What works...