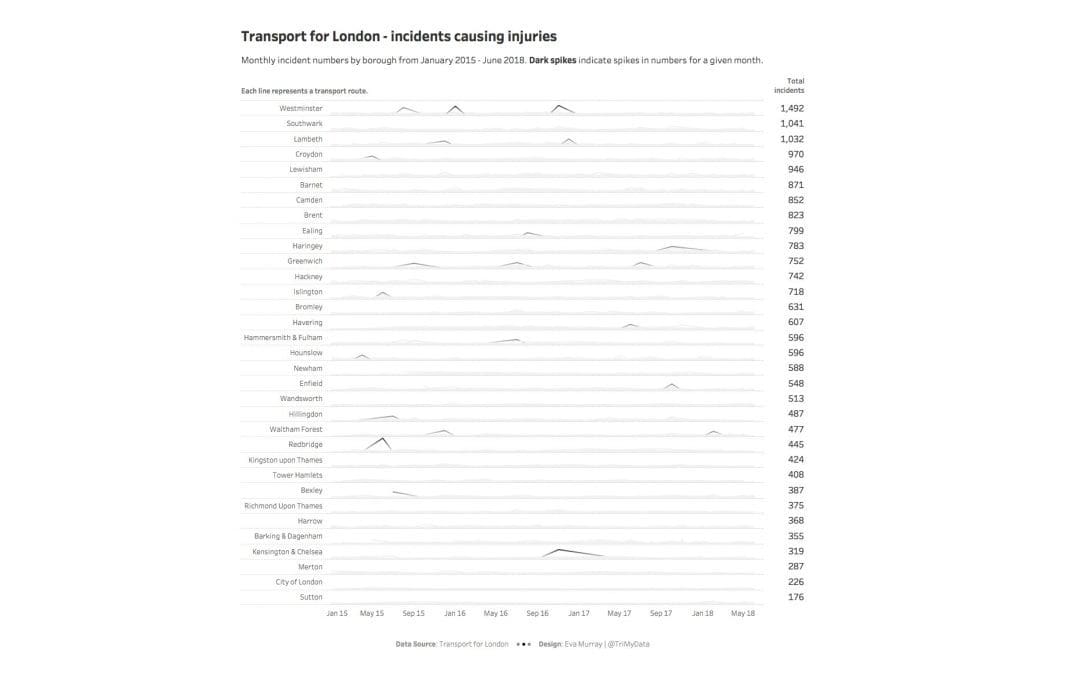
by Eva Murray | Dec 17, 2018 | Makeover Monday, Tableau
In September this year, Andy was hit by a bus while out on a ride. I had a few close calls myself over the years with cars, buses and trucks. Especially in Australia, where many drivers sadly treat cyclists like cockroaches. But even in Germany, a country where most...
by Eva Murray | Dec 10, 2018 | Makeover Monday, Tableau
It is week 50 already and where has this year gone? The 50th week of Makeover Monday in 2018 and another opportunity to improve the way we visualize and analyze data. This week we’re looking at the land use for producing different food types. What works...
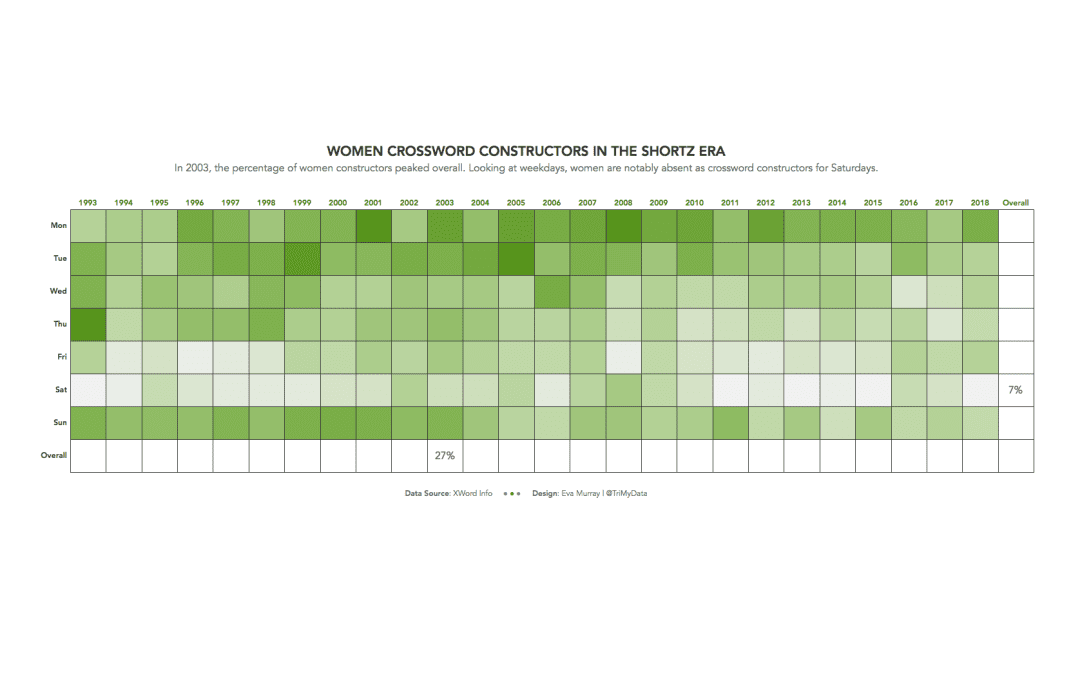
by Eva Murray | Dec 2, 2018 | Makeover Monday, Tableau
What a random dataset: how many women were constructors of crosswords during the Era of Will Shortz. I like these topics that come completely unexpected and force me to learn something first before tackling the data. Admittedly, I’ve never spent a single thought...
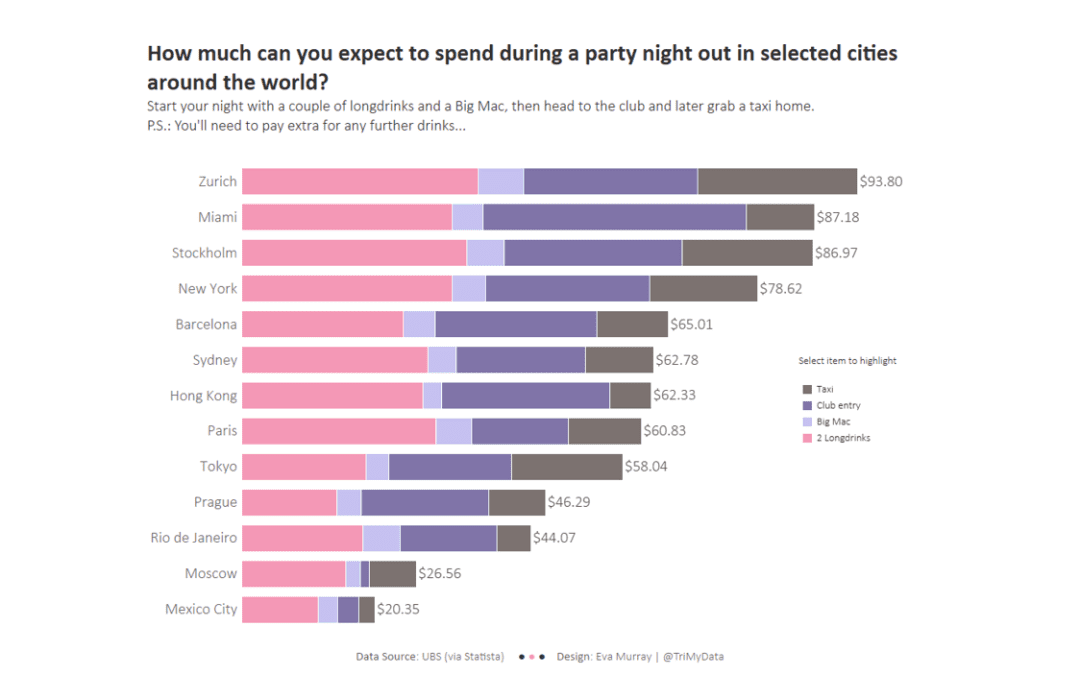
by Eva Murray | Nov 26, 2018 | Tableau
As we head into ‘silly season’ and are only a few days away from December with all its Christmas parties, having a look at the cost of a night out in different cities around the world gives us an appreciation for how much a bit of entertainment will set...
by Eva Murray | Nov 19, 2018 | Tableau
After a very active day of redecorating, cycling, running and (somehow) a yoga lesson, the only thing I can still move with some coordination are my fingers on the keyboard, so let’s get into this week’s Makeover Monday challenge.The original viz comes...
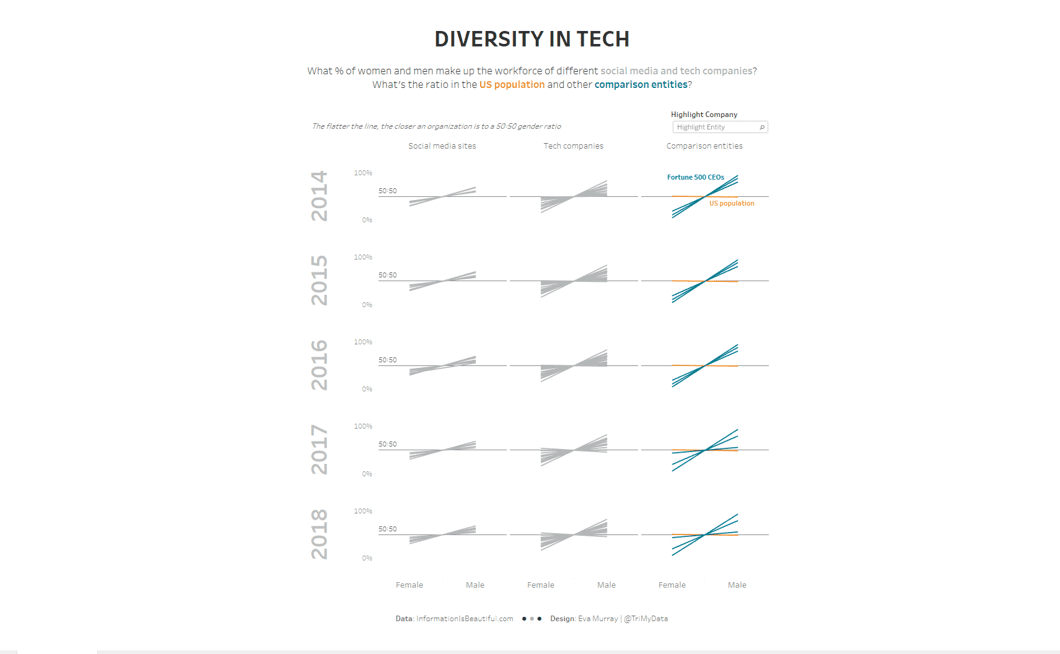
by Eva Murray | Nov 11, 2018 | Makeover Monday, Tableau
Diversity, particularly gender diversity, in business has been a hot topic for the past few years and is something we shouldn’t stop talking about until we’ve made some progress.This week’s Makeover Monday dataset looks at the makeup of workforce of...