Nudges, Ideas and a sprinkle of career advice
This is where you’ll read from me. It’s a mix of nudges that encourage you to take the next bold step, ideas that help you make a change and advice so you can avoid the mistakes I made along the way.
From my keyboard to you. No ChatGPT involved, just a bunch of honest writing, usually done in the morning hours before the world wakes up.
I hope you enjoy it and I’d love to hear from you, so feel free to comment on these posts.
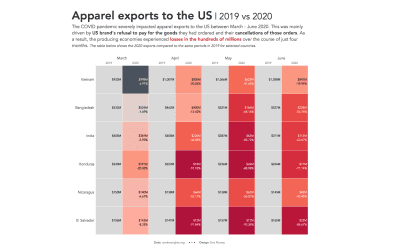
#MakeoverMonday 2020 Week 43: Apparel Exports to the US
For this week’s #MakeoverMonday, Charlie chose a dataset about the unpaid apparel orders by US brands from their producers, resulting in severe detrimental impacts on workers rights and businesses.
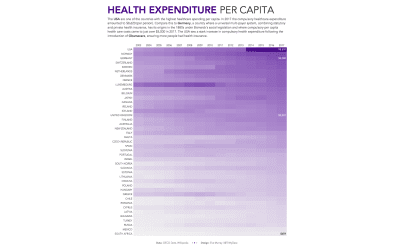
#MakeoverMonday 2020 Week 42: Health spending
For week 42 I created a heat map to show health spending in different countries over time. The US certainly stand out on a per capita basis.
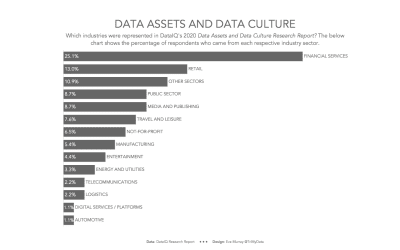
#MakeoverMonday 2020 Week 41: Data assets and data culture
This week’s dataviz challenge takes a terrible chart that communicates nothing and turns it into something that’s easy to understand.
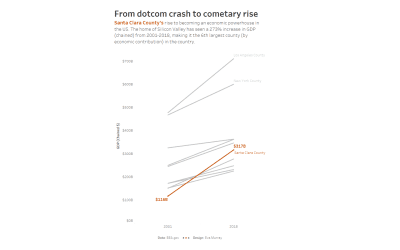
#MakeoverMonday 2020 Week 40: The U.S. Counties With the Highest Economic Output
This week’s #MakeoverMonday is a very simple chart in Tableau that I created during our #MMLIVE event to kick off the week of #data20.

#MakeoverMonday 2020 Week 39 – #Viz5: Child Marriage
This week I use Tableau and Canva to create an infographic style visualization focusing on the worst data point: almost 30% of girls in Chad are married by the age of 15.
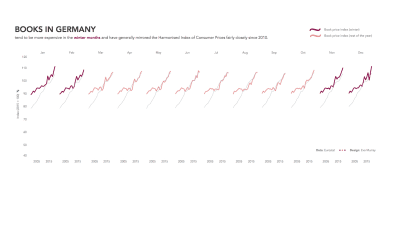
#MakeoverMonday 2020 Week 38: Books in Germany
Line charts are easy and quick to create in Tableau and you have great flexibility to move your date fields into any order you choose. That’s how I created this week’s cycle plot for book prices in Germany.
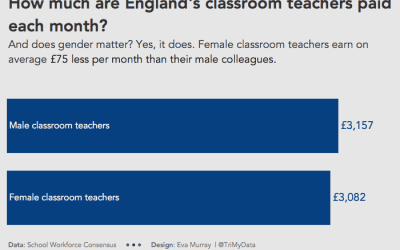
#MakeoverMonday 2020 Week 37: England Teacher Salaries
I used the #MakeoverMonday dataset to build a very simple but clean bar chart in Tableau
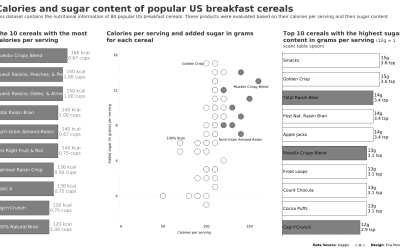
#MakeoverMonday 2020 Week 36: Calories and Sugar in Cereals
How do you create a true makeover of a viz? Evaluating the existing one, then taking several steps to improve on it is the approach I took this week for come up with my own viz about calories and sugar in breakfast cereals.
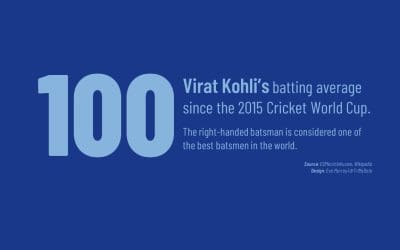
#MakeoverMonday 2020, Week 35: Indian batsmen vs. left-arm pace
Virat Kohli’s batting average since the 2015 Cricket World Cup
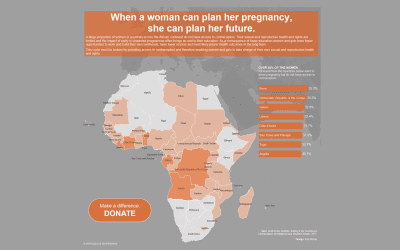
#MakeoverMonday 2020 Week 34: Sexual and reproductive health and rights
For week 34 of #MakeoverMonday, we are once again partnering with the team at Operation Fistula for a #Viz5 challenge, visualizing data about the issues impacting women and girls. This time, we’re looking at Sexual and Reproductive Health and Rights.
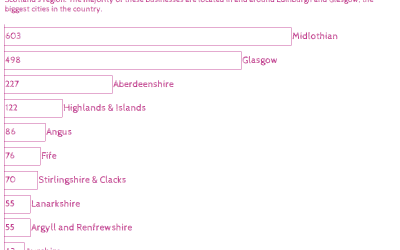
#MakeoverMonday 2020, Week 33: Scotland – the state of the digital nation
A simple bar chart for this week’s #MakeoverMonday about tech companies in Scotland
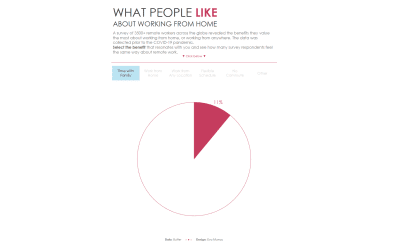
#MakeoverMonday 2020 Week 32: The Benefits of Working from Home
A quick visualization to show the benefits of working from home, as reported via a survey.