by Eva Murray | May 28, 2018 | Tableau
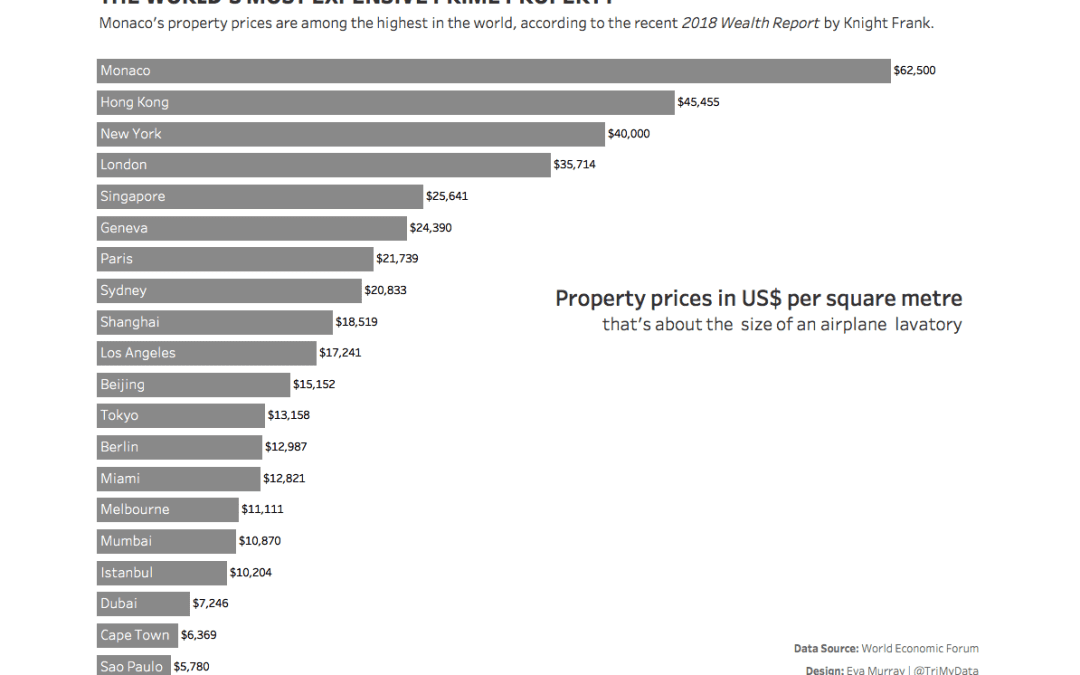
A couple of weeks ago, Sarah Bartlett shared a link to the viz we’re using for this week’s makeover.What’s great is that the dataset is very simple, one dimension and one measure.No doubt there will be richer datasets in the future but what Andy and...
by Eva Murray | May 26, 2018 | Life stuff, Triathlon
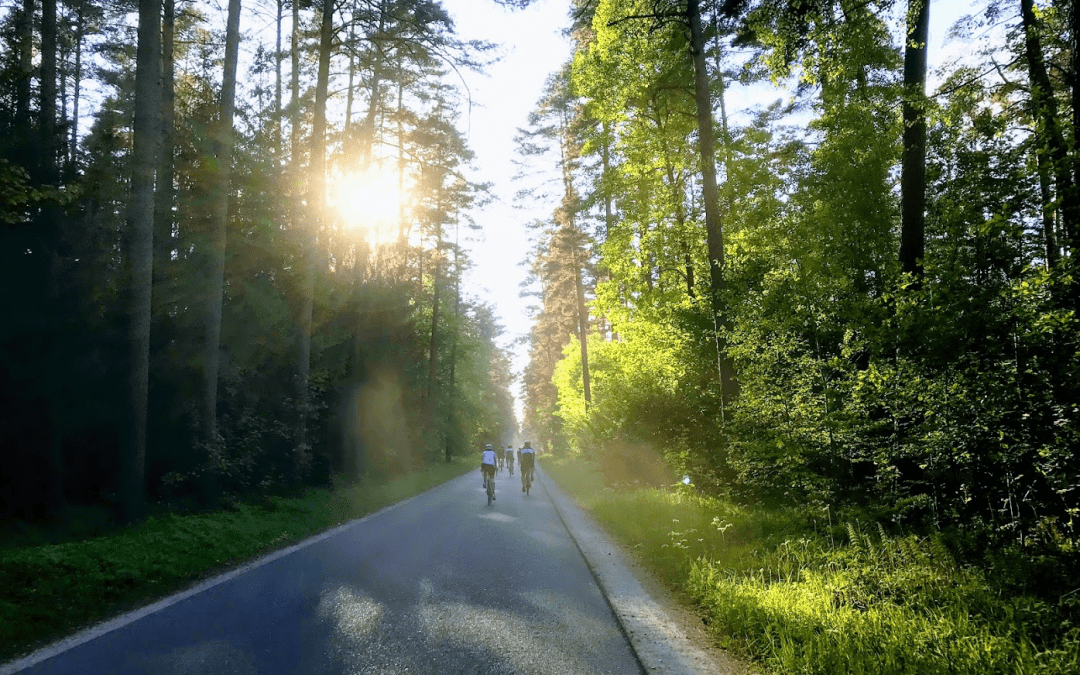
Every time before a big training ride I get scared.It’s not that I worry that I’ll be run over by a car or get lost and forget to leave a trail of breadcrumbs to find my way home. No, it’s the fear that I will fail. That instead of riding for X hours...
by Eva Murray | May 21, 2018 | Tableau
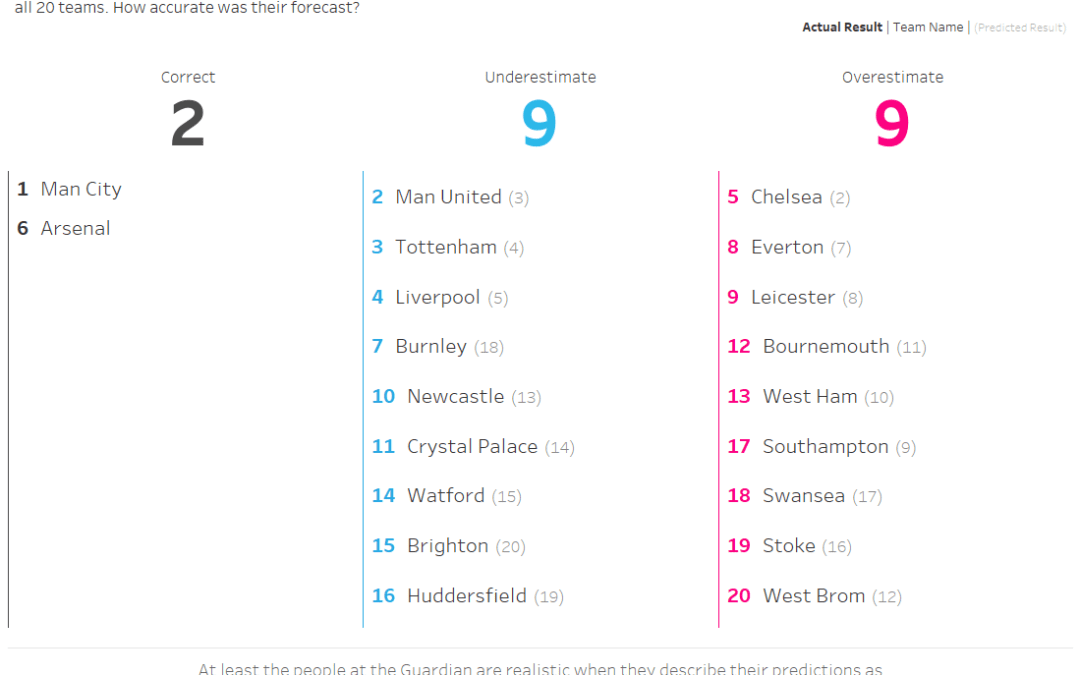
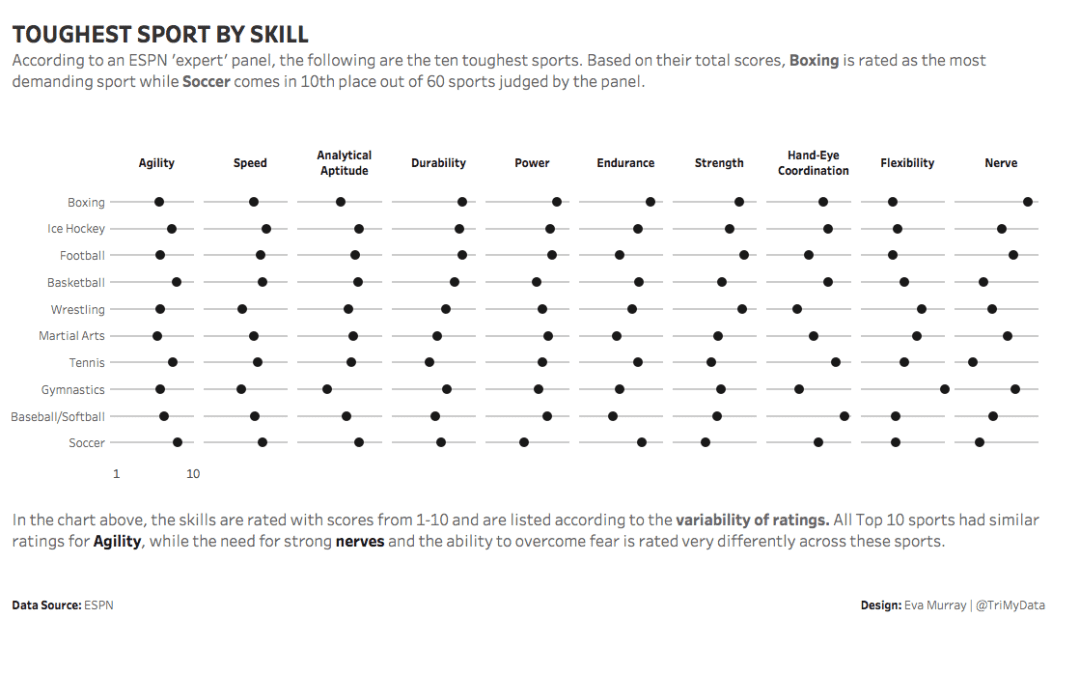
Here we go again: sports data. It’s not that I don’t like sports. Actually, I love sports. I love participating, but not watching in front of the TV. When it comes to football (or soccer as some of you call it), there is really only one tournament I watch....
by Eva Murray | May 14, 2018 | Tableau
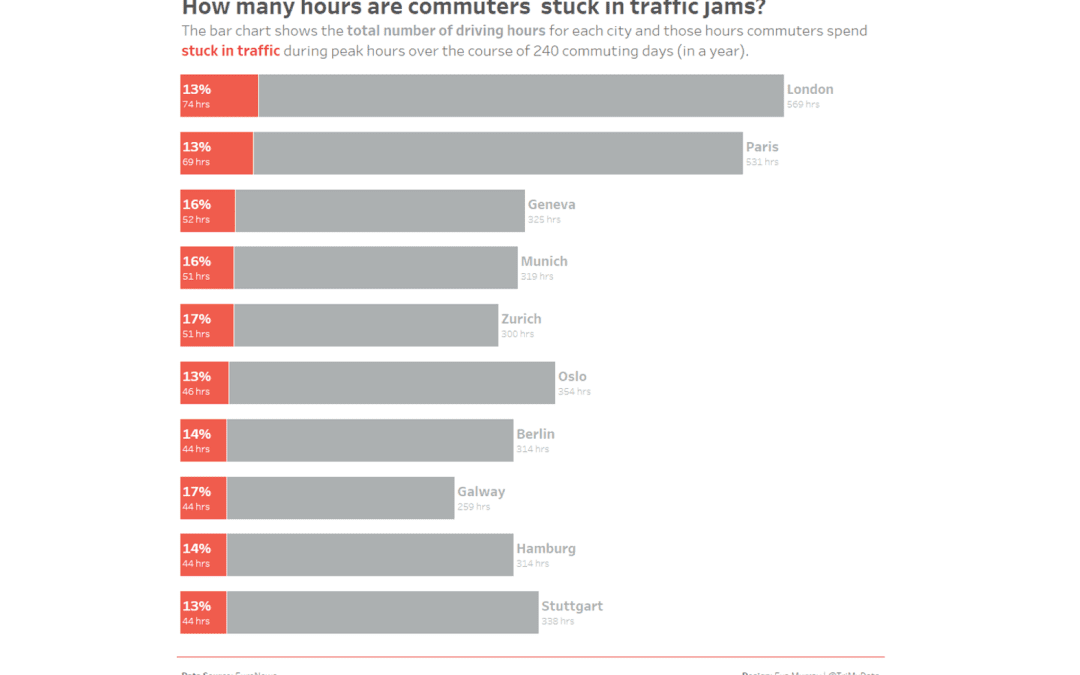
Traffic jams are an unpleasant side effect of living in cities and driving cars. After my move to Nuremberg last August, my commute changed significantly. Instead of a frustrating 60min drive each way, I now spend a pleasant 12-14 minutes riding my city cruiser bike...
by Eva Murray | May 7, 2018 | Tableau
In this week’s dataset, the first thing I did was to sort the sports by Endurance and voila, distance cycling is on top. My faith in the world is restored and I can turn my attention to this week’s ESPN sports ranking by apparent...