by Eva Murray | Jul 2, 2018 | Tableau
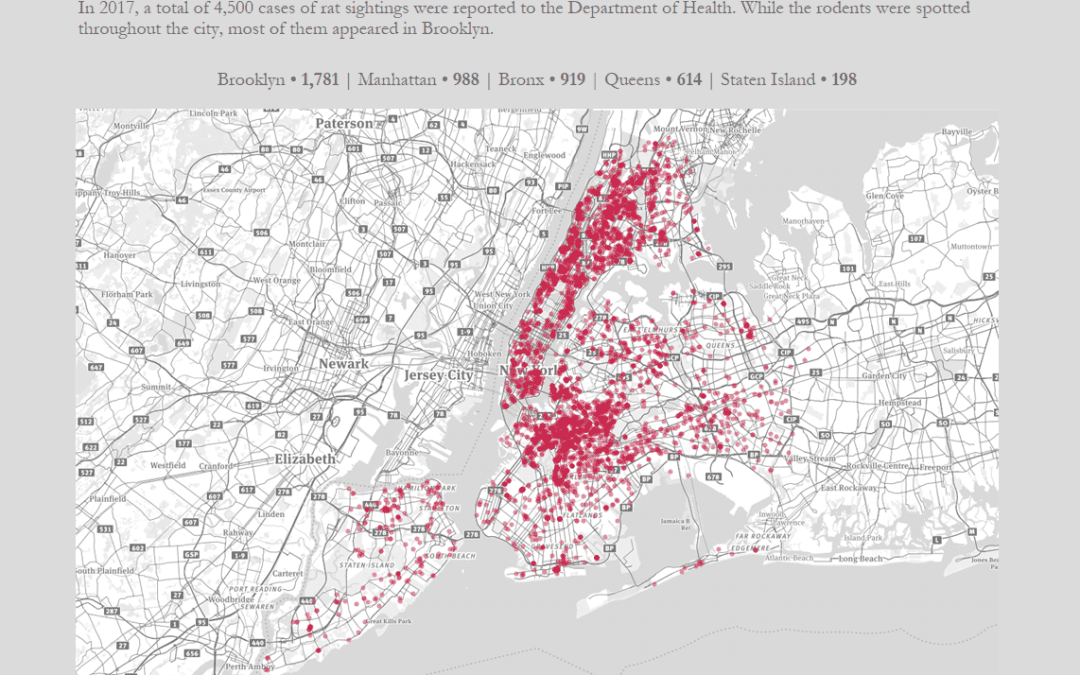
For week 27 we will have two datasets. The official Makeover Monday dataset about Rat Sightings in NYC as well as a secret, yet-to-be-revealed dataset which we’ll use at TC18 in London this coming week.For now, let’s check out what Splinter and his mates...
by Eva Murray | Jun 24, 2018 | Tableau
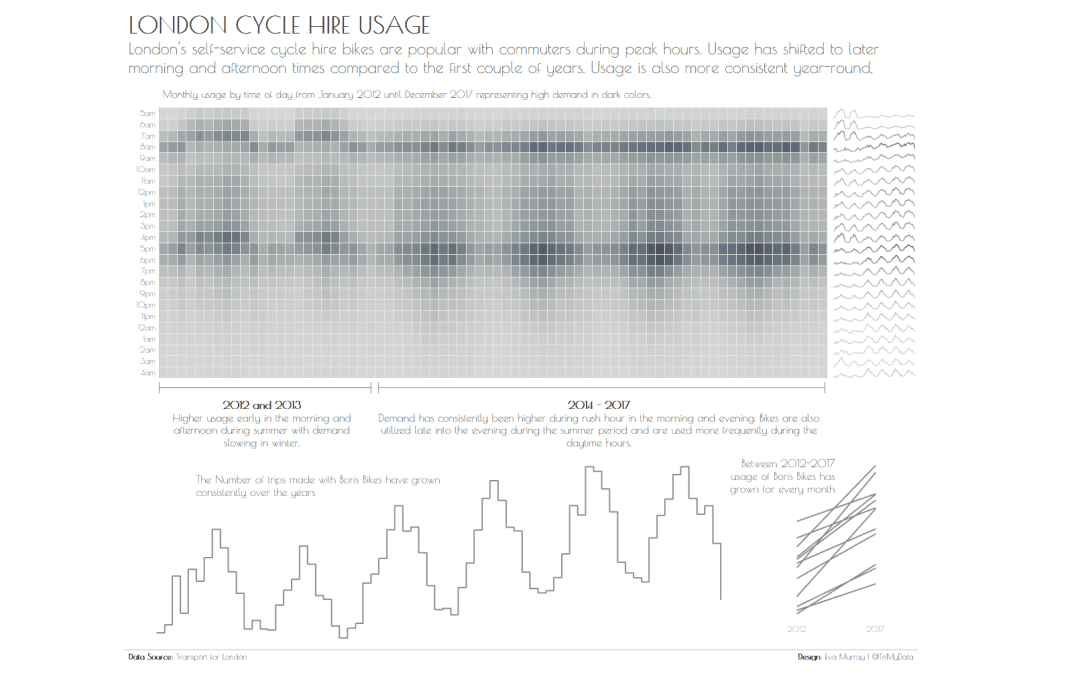
We have reached the half-way point of the year. 26 weeks of Makeover Monday (almost) behind us, 26 weeks of Makeover Monday to go.For this week we’re playing with a large dataset again, looking at the hire usage of London’s Boris Bikes. The original...
by Eva Murray | Jun 18, 2018 | Tableau
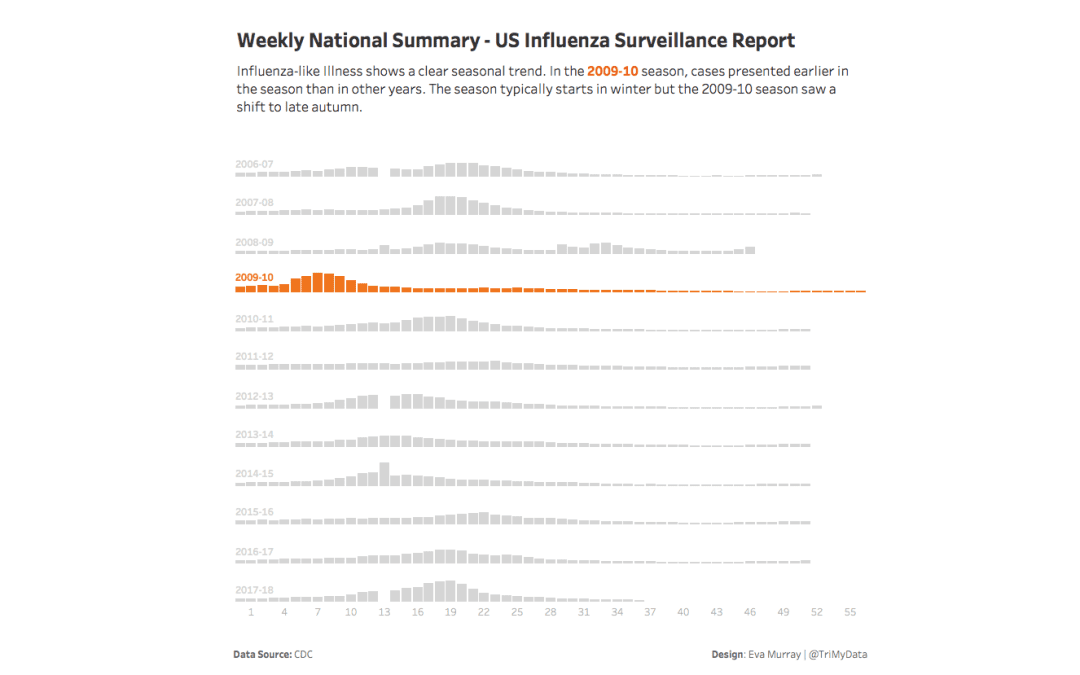
We are almost halfway through the year and I have no idea where the time has gone so quickly. Wasn’t it just March not long ago???I’ve been enjoying an extended stay in Berlin for the past week and a bit and will be travelling home today (Sunday) to get...
by Eva Murray | Jun 10, 2018 | Tableau
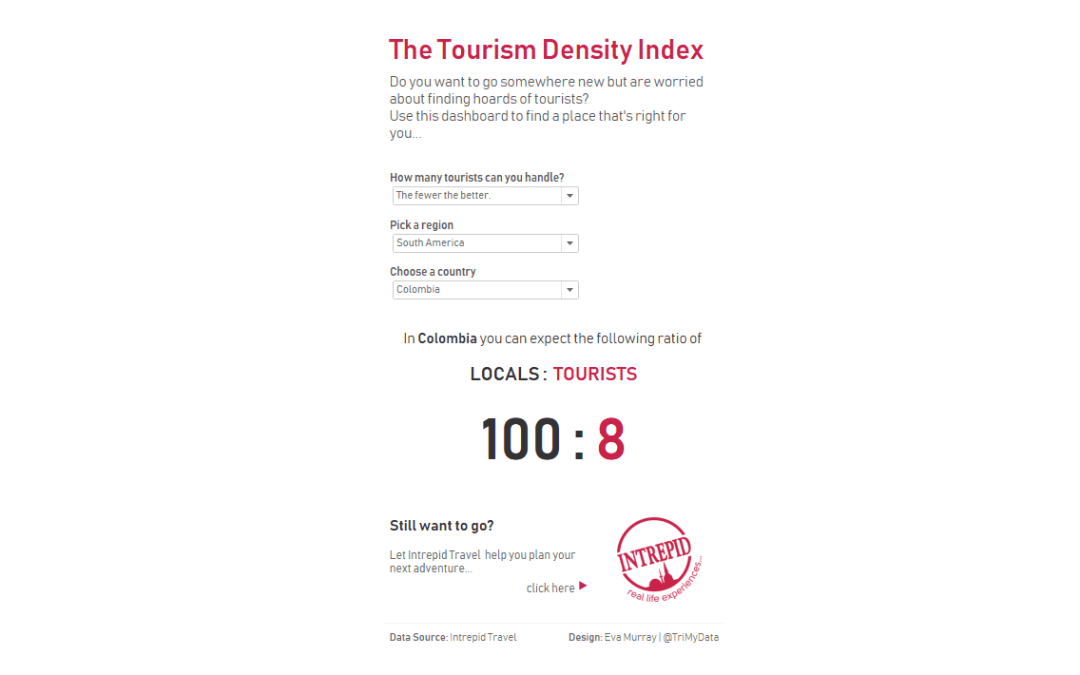
This dataset found its way to me through some sponsored content on an Australian news website recently and I thought the topic was really interesting. At the same time, the dataset is easy to understand yet provides plenty of opportunity for different angles,...
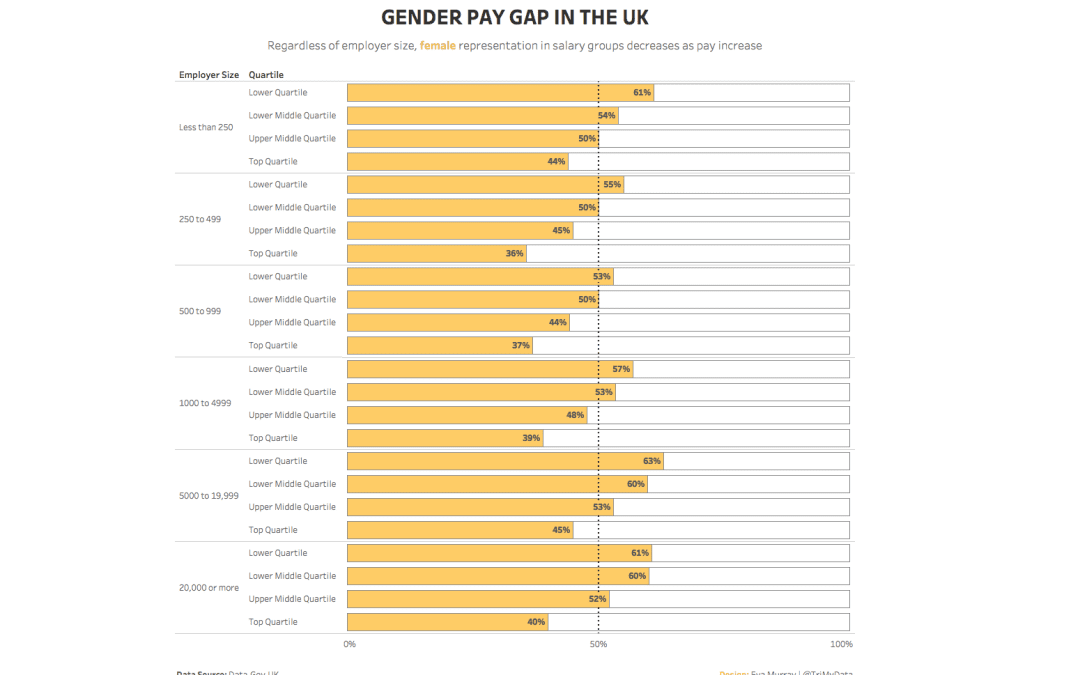
by Eva Murray | Jun 4, 2018 | Tableau
What a tough dataset Andy picked for this week. As much as I enjoy a good dig around the data, I do value my sleep and I’m missing out because I’m trying to make sense of this data.With a topic like the gender pay gap, it’s not like I’m happy...