by Eva Murray | Oct 7, 2018 | Tableau
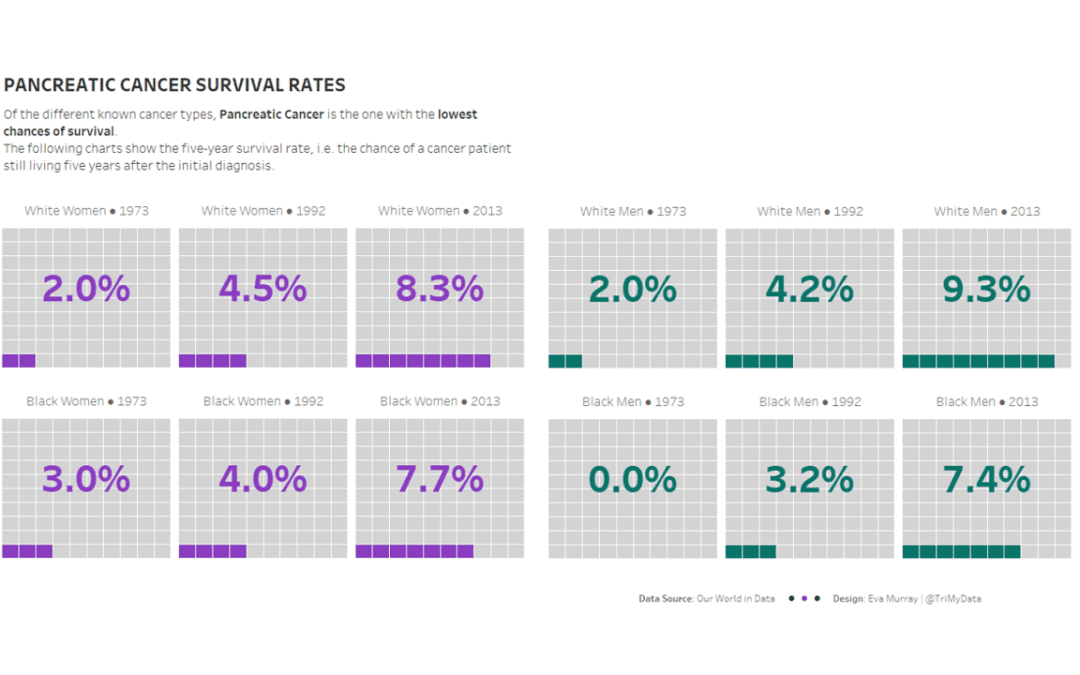
Two weeks until we all (hopefully) meet in New Orleans at TC18.Time to sharpen up our dataviz act. This week we’re looking at Cancer Survival Rates. Seems like a sad topic at first, but it’s about survival, not death, so hopefully things are moving in the...
by Eva Murray | Oct 1, 2018 | Tableau
Avocadoes are quite easily the tastiest fatty fruit I know. They’re amazingly delicious and finding a perfectly ripe avocado always feels like a major accomplishment. This week Andy gifted me a dataset about avocado prices, and it’s a nice and simple one....
by Eva Murray | Sep 24, 2018 | Tableau
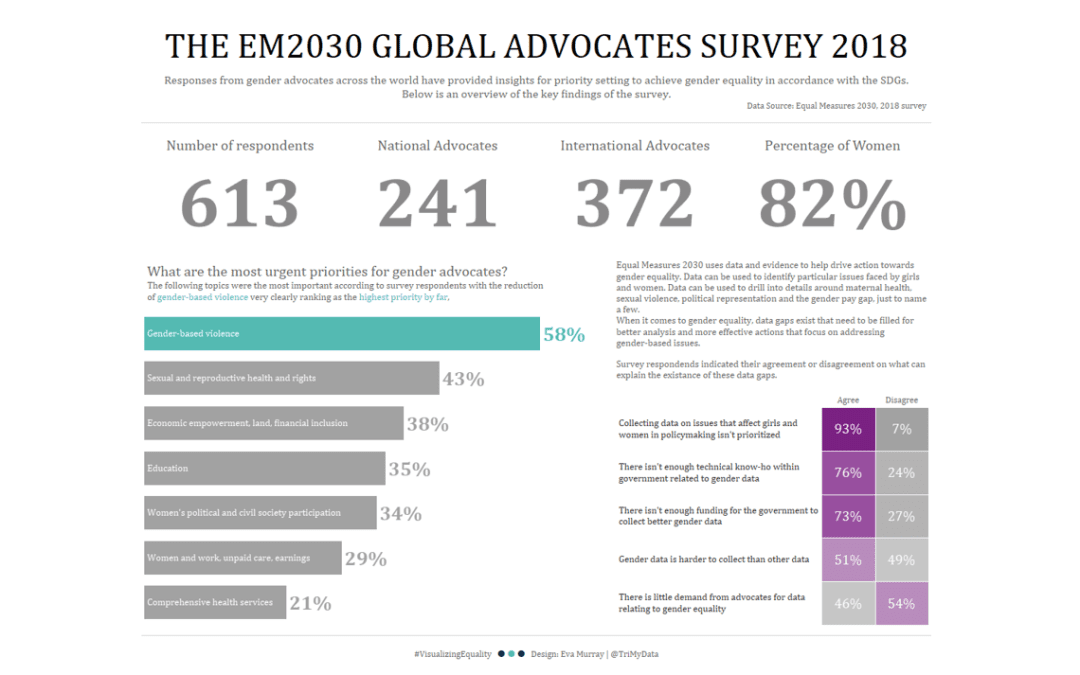
Collaborations for Makeover Monday mean that we partner with a non-profit organization to help them crowd-source visualizations that support their mission and help them create awareness through data and analysis.This week we’re collaborating with Equal Measures...
by Eva Murray | Sep 17, 2018 | Tableau
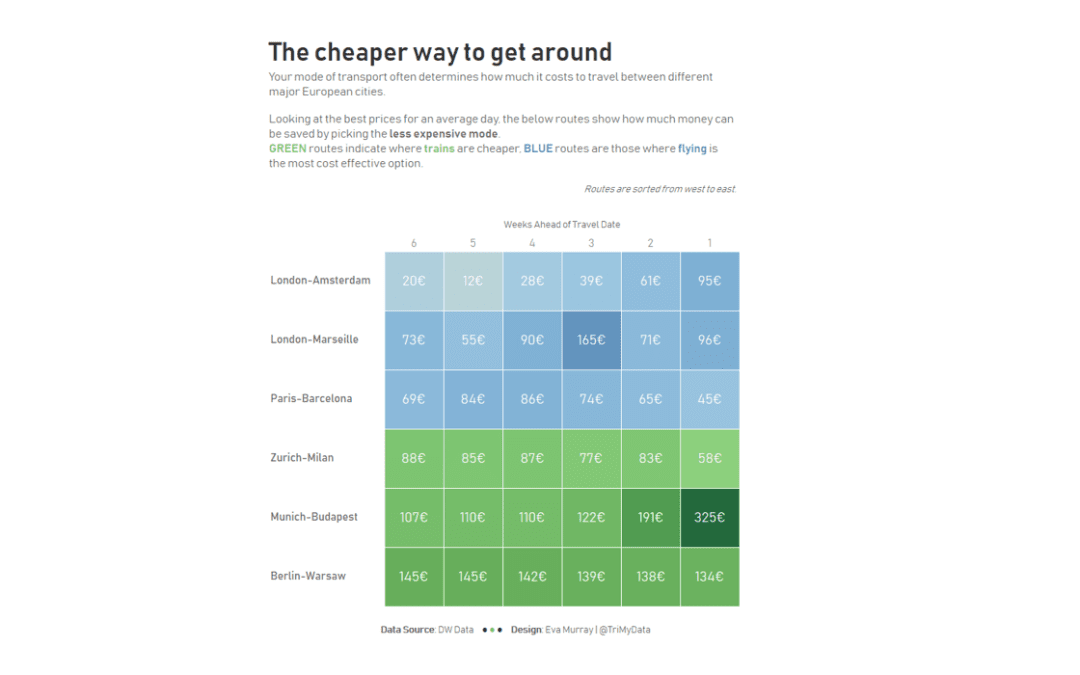
Faced with this question for my very frequent trips which see me to go different places at least twice a month, I actually stumbled on this viz and dataset through my twitter feed and thought it would be great for MakeoverMonday. Not only is the data nice and simple,...
by Eva Murray | Sep 9, 2018 | Tableau
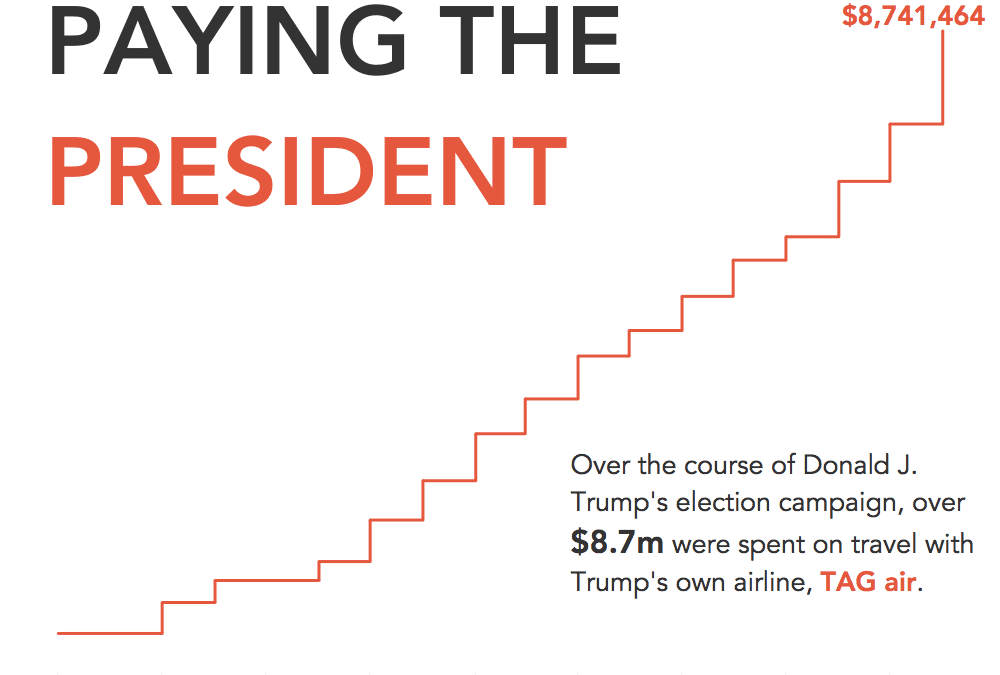
For week 37 we are looking at the spending of people and organisations with funds going to Trump’s companies. Interesting topic, even though I’m not a huge fan of political data because it typically infuriates me. Especially when Trump is involved.The...