by Eva Murray | Jan 6, 2020 | Tableau
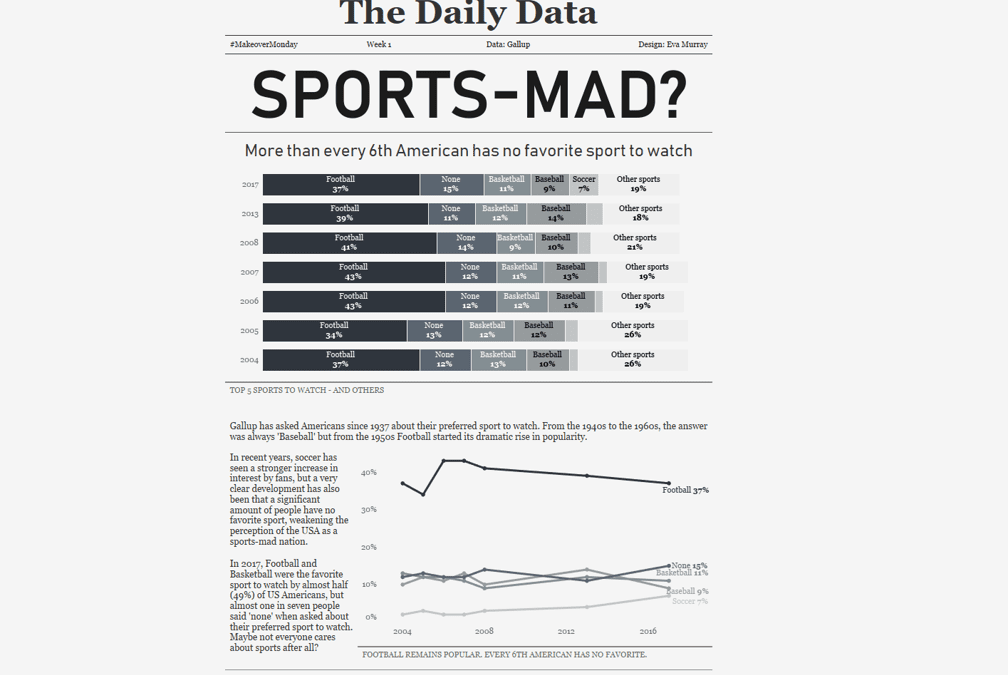
For his first dataset, Charlie picked the topic of how popular different American sports are with spectators. Here is the original viz from Vox.com What works well: A nice and simple chart Lines are labeled I like the focus on the top 3 Colors are easy to...
by Eva Murray | Dec 29, 2019 | Makeover Monday, Tableau
So it has arrived, Andy’s last week as co-host of #MakeoverMonday. After 4 years of running this project (first with Andy Cotgreave, then with me), he is handing over the baton to Charlie to focus on other life projects. For his last dataset choice, Andy selected data...
by Eva Murray | Dec 22, 2019 | Makeover Monday, Tableau
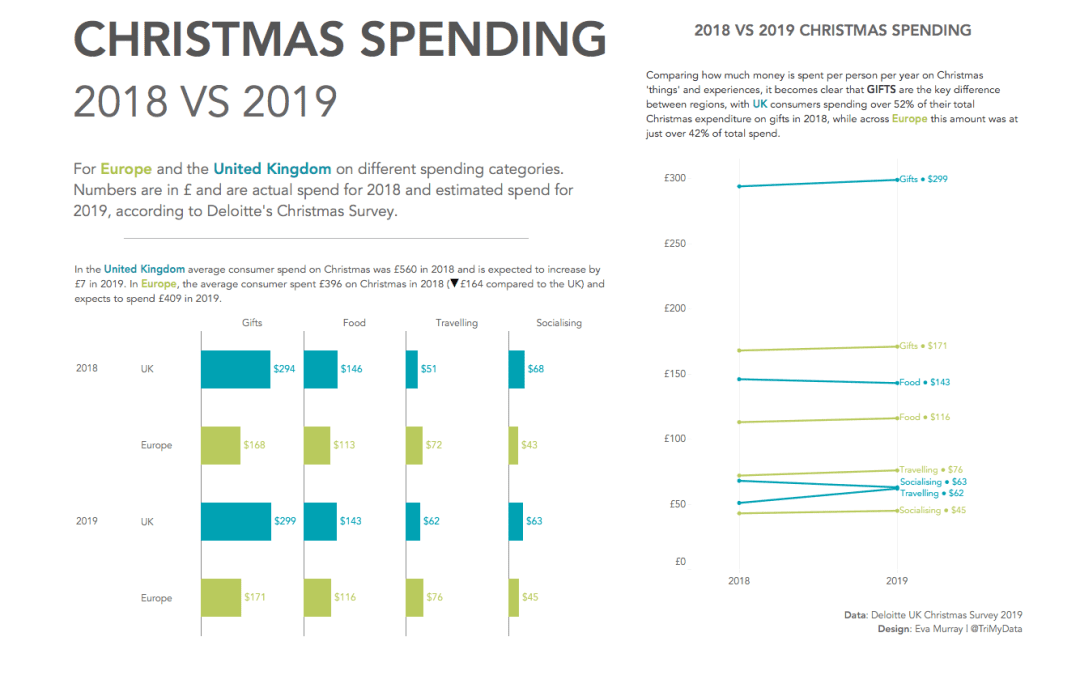
My last dataset for this year falls into Christmas week, so after a little convincing from Andy I set aside the data I had originally planned to use and picked a simple Christmas spending dataset from the Deloitte Christmas Survey 2019. Here is the original viz: What...
by Eva Murray | Dec 16, 2019 | Makeover Monday, Tableau
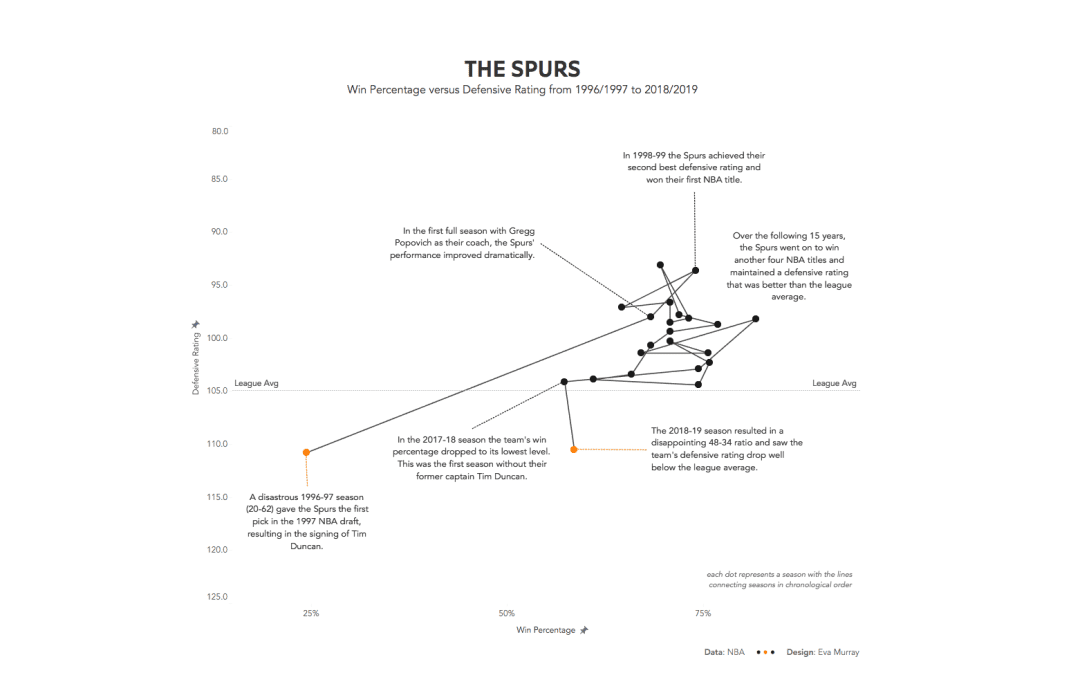
For this week, Andy chose a Basketball dataset. My expertise on that topic is limited to the claim of coming from the same town as the 6-time German champion team Brose Baskets. I went to see one of their games and all I remember is that it was really loud and fast...
by Eva Murray | Dec 9, 2019 | Tableau
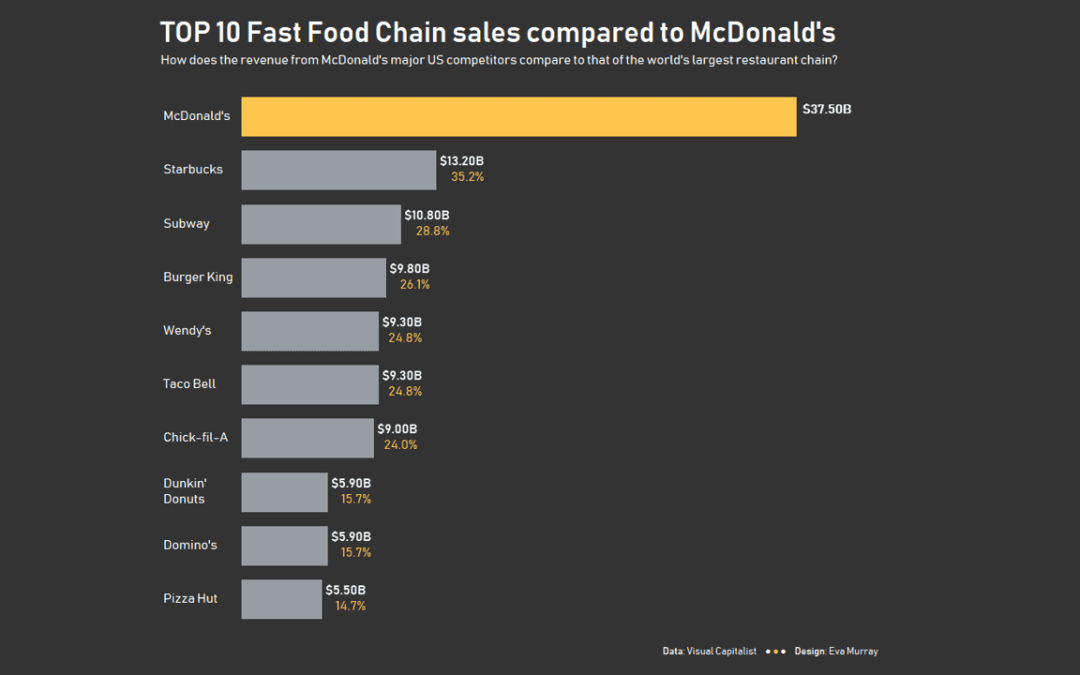
For week 50 of Makeover Monday in 2019, we’re analysing the revenue of America’s biggest fast food chains. Thanks to Andy for finding the viz and the data when all my search efforts resulted in terrible results. Here is the original viz from Visual...