by Eva Murray | Nov 16, 2020 | Makeover Monday, Tableau
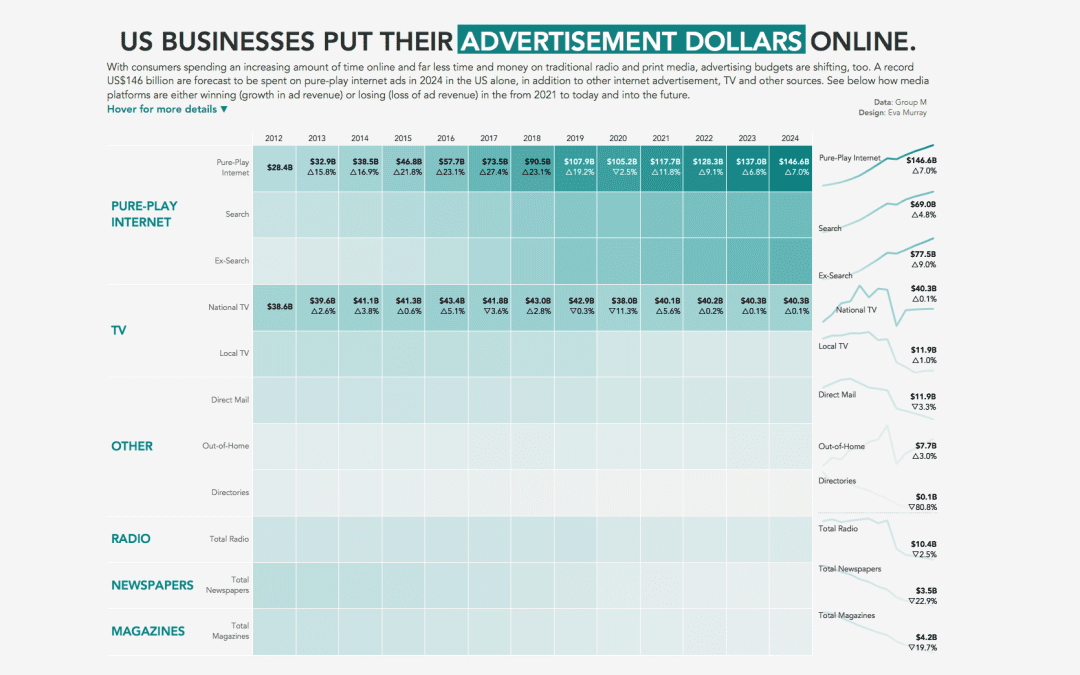
Andy found a great viz for this week’s #MakeoverMonday challenge and kindly dug out the data for me as well as I’m managing a few different projects at the same time. This week we’re looking at advertising spend in the US with the original viz...
by Eva Murray | Nov 13, 2020 | Tableau
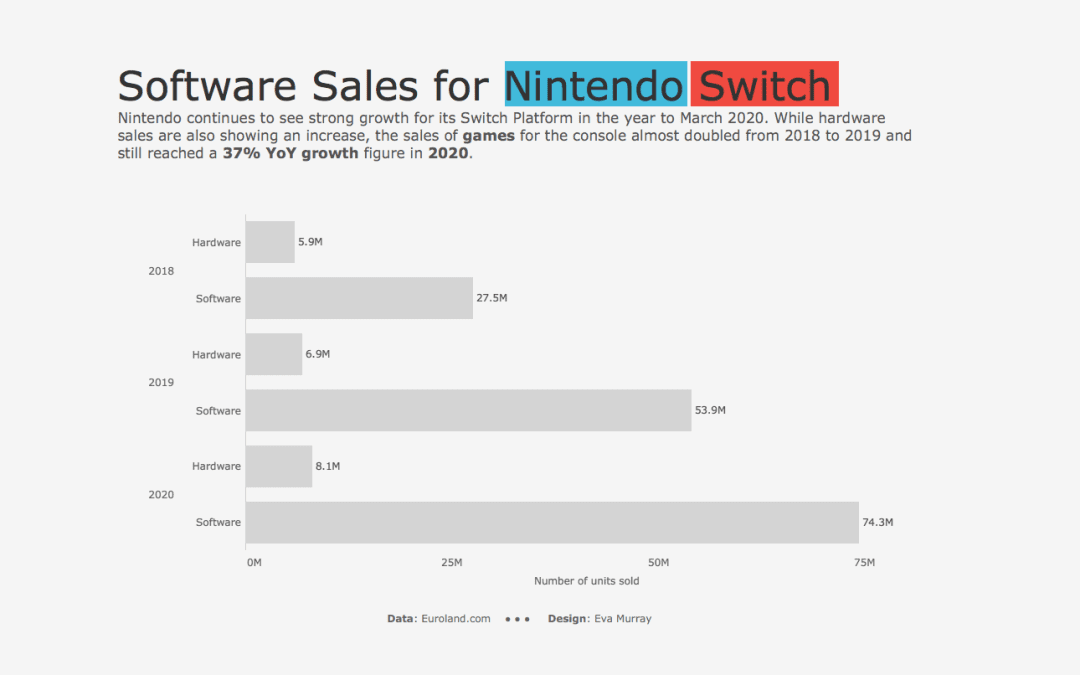
It’s already the end of the week and what a week it’s been. Life is pretty full at the moment, so I’m challenging myself to a very quick and time-boxed #MakeoverMonday this week. We’re looking at Video Game Sales Units with the original viz...
by Eva Murray | Nov 4, 2020 | Makeover Monday
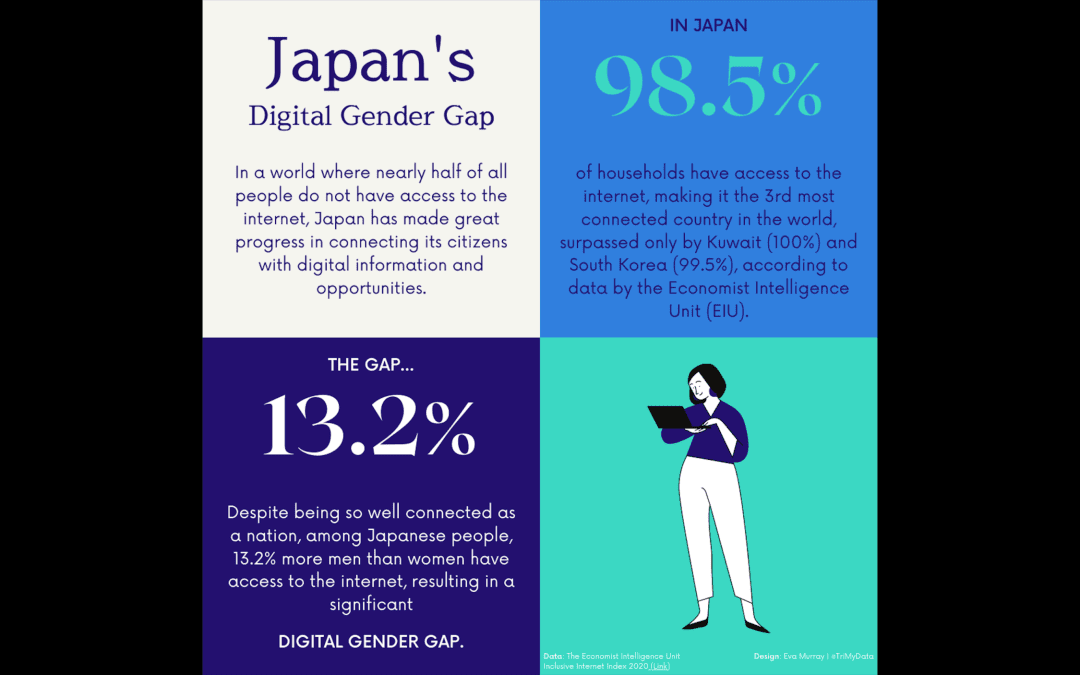
It’s time for another #Viz5 challenge and this time we’re analysing data about the digital gender gap – just how big is the difference between men and women when it comes to accessing the internet and mobile devices? The team at Operation Fistula...
by Eva Murray | Oct 30, 2020 | Tableau
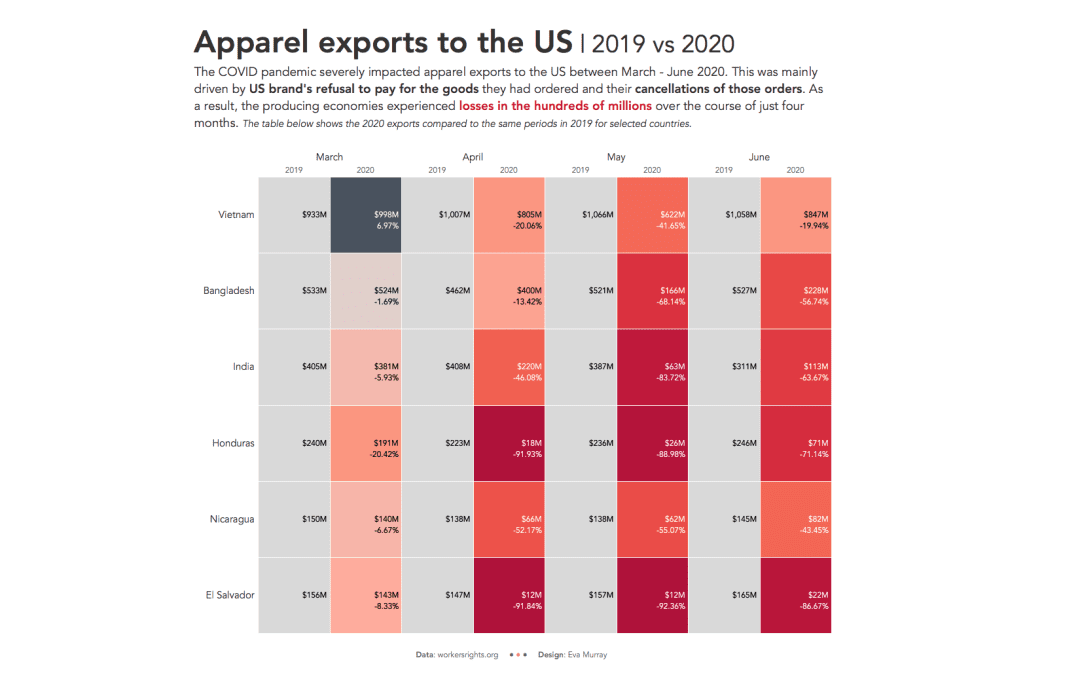
For this week’s #MakeoverMonday, Charlie chose a dataset about the unpaid apparel orders by US brands from their producers, resulting in severe detrimental impacts on workers rights and businesses. This is the original visualization:...
by Eva Murray | Oct 20, 2020 | Makeover Monday, Tableau
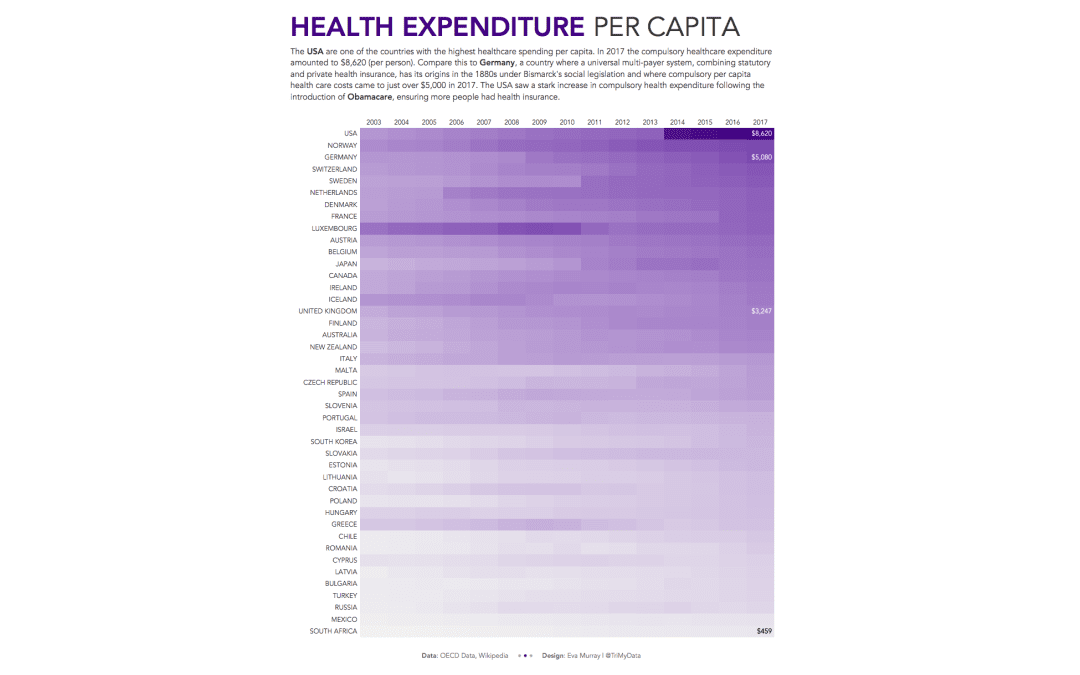
A quick viz this week and a quick blog, looking at health spending per capita in different countries. I’ll admit, I wanted to do a heat map before even looking at the data, so a heat map it is. This week we’re looking at OECD data about healthcare...