by Eva Murray | Apr 22, 2020 | Tableau
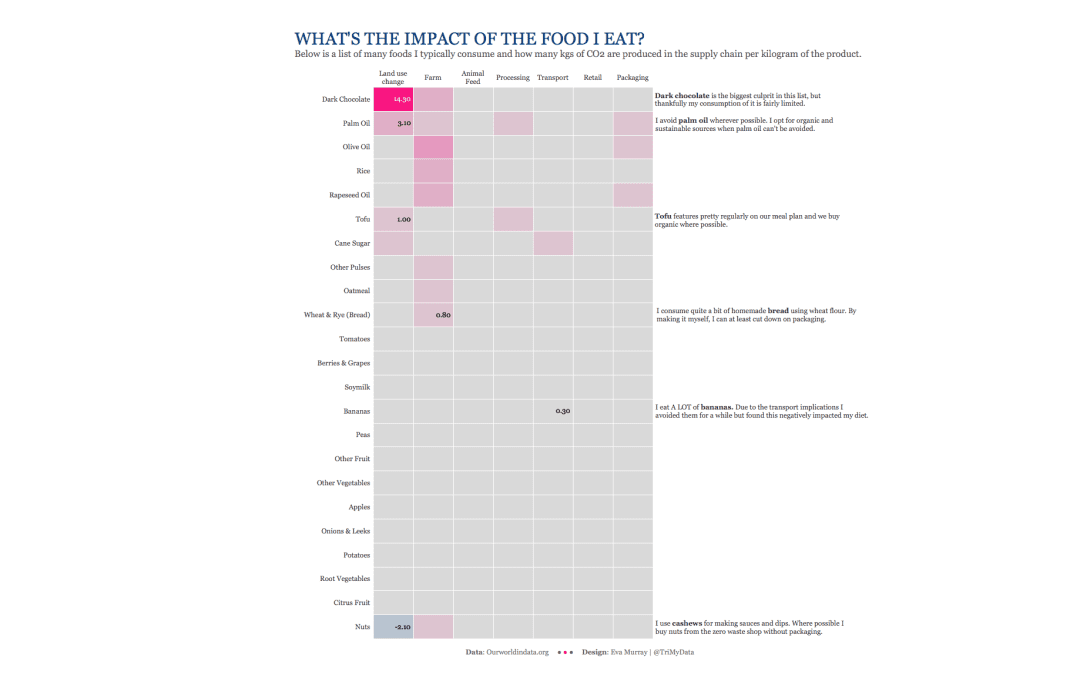
As we all eat multiple times a day, I decided to look for a visualization about food and found this one about the emissions linked to different types of foods. It comes as part of an article about eating local versus focusing on ‘what’ to eat. What works...