by Eva Murray | Dec 28, 2020 | Makeover Monday, Tableau
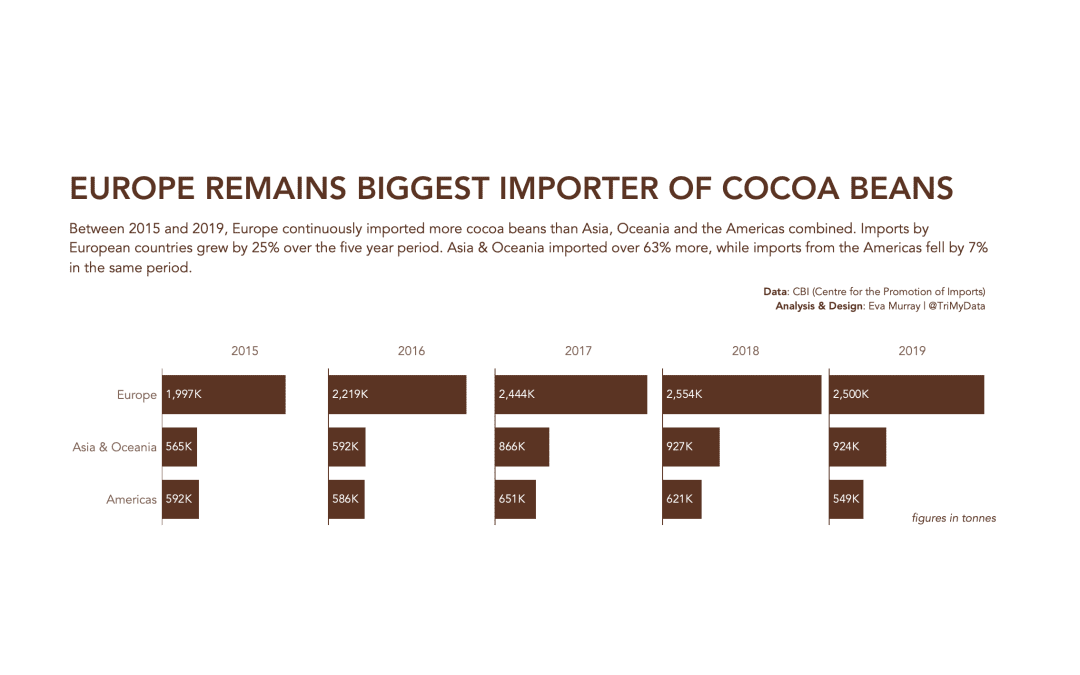
This has to be quick. 2020 somehow still hasn’t finished and this Monday has been dragging on for what feels like 40 hours now. Let’s make it a bar chart to end the year. But first: Here is the original viz, looking at cocoa import stats for regions across...
by Eva Murray | Dec 15, 2020 | Makeover Monday, Tableau
Who doesn’t love Bob Ross? I imagine that most people who have seen him on TV have been mesmerized by his ability to capture beautiful landscapes with the dab and the brush stroke of his paint brushes with such apparent ease that made everyone feel like they...
by Eva Murray | Nov 25, 2020 | Makeover Monday, Tableau
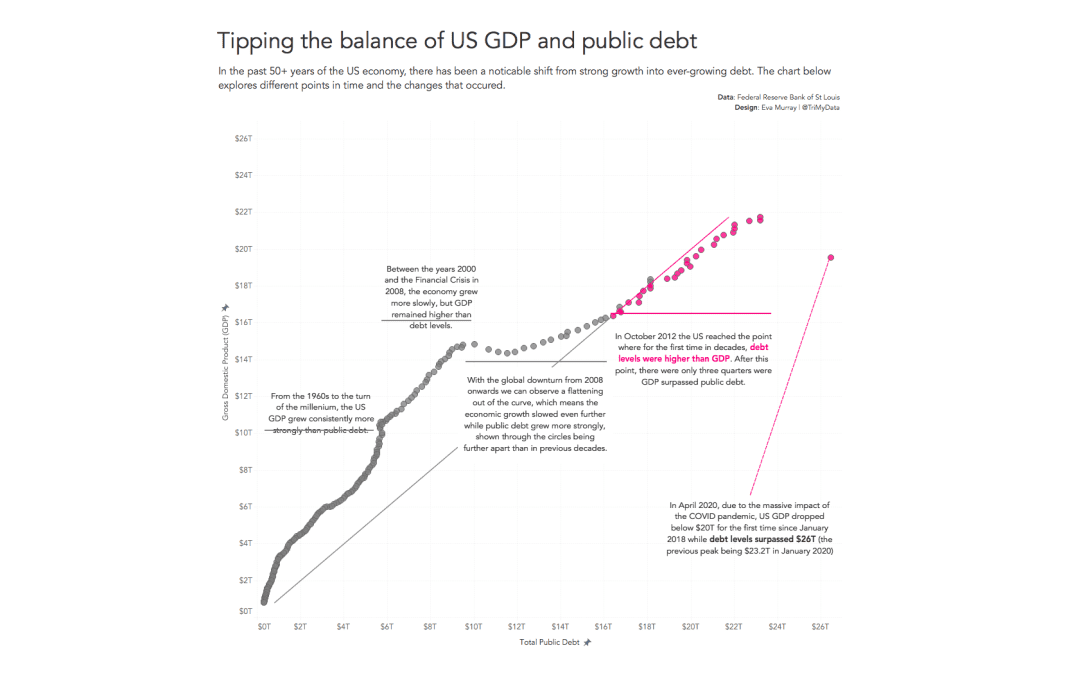
This week is, much like many recent weeks, a busy one for me with many commitments that mean MakeoverMonday had to be delayed by a couple of days. But here we are, ready to build a viz about the debt of the US. The original infographic Charlie chose for this exercise...
by Eva Murray | Oct 12, 2020 | Makeover Monday, Tableau
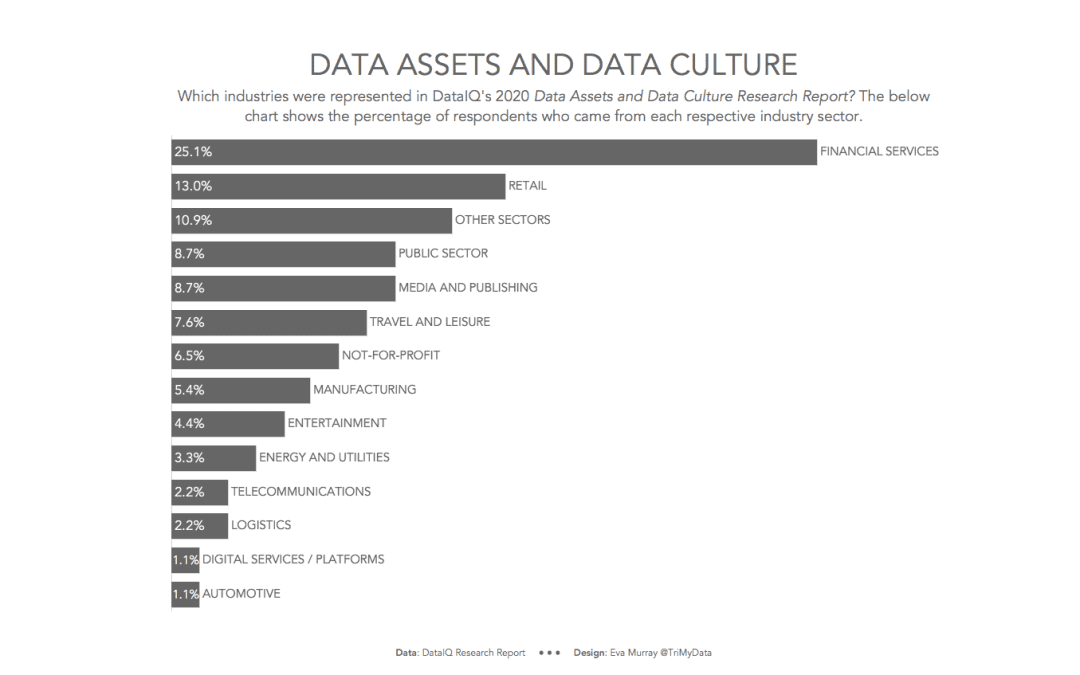
For week 41, Charlie found a whopper of a chart that is in such desperate need of a makeover. After last week’s excitement around #data20, this week should see us all relax a little and go back to business. So here is this week’s visualization from DataIQ,...
by Eva Murray | Oct 5, 2020 | Makeover Monday, Tableau
This week it’s time for #data20, Tableau’s virtual conference and to get everyone’s engine warmed up, we’re hosting live Makeover Monday events (Morning and Afternoon session) because we do every Monday before conference. They’re just...