Nudges, Ideas and a sprinkle of career advice
This is where you’ll read from me. It’s a mix of nudges that encourage you to take the next bold step, ideas that help you make a change and advice so you can avoid the mistakes I made along the way.
From my keyboard to you. No ChatGPT involved, just a bunch of honest writing, usually done in the morning hours before the world wakes up.
I hope you enjoy it and I’d love to hear from you, so feel free to comment on these posts.
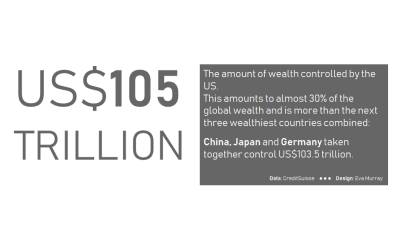
#MakeoverMonday 2020, Week 7: World Wealth
For this week’s #MakeoverMonday challenge, Charlie chose a terrible chart that is in desperate need of a makeover.
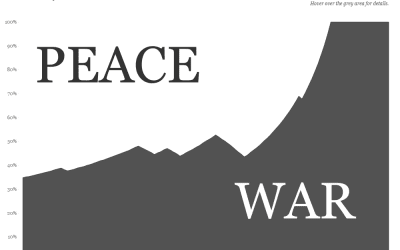
#MakeoverMonday 2020, Week 6: How much of your life the US has been at war
A few weeks ago, someone shared a viz from the Washington Post with me that showed how much of 'your' life the US has been at war, depending on someone's year of birth. I thought this was a fascinating way to look at the data, so decided to challenge the community to...

#MakeoverMonday 2020, Week 5: Brexit Bond
For week 5, Charlie picked an interesting dataset, stemming from a survey of Brits on how they voted in political elections as well as their opinion on James Bond actors and how open they are to a future Bond being female, gay, of ethnic minority origin or non-British.
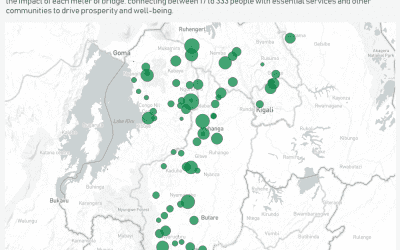
#MakeoverMonday 2020, Week 4: Bridges for Prosperity
This week #MakeoverMonday is collaborating with Bridges for Prosperity, supporting them to tell more effective stories with data about the amazing work they do.
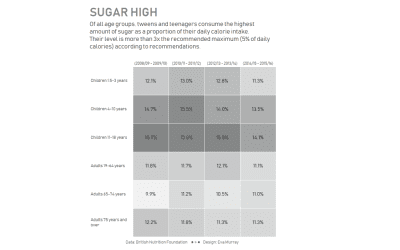
#MakeoverMonday 2020 Week 3: Is it time to treat sugar more like smoking?
For week 3, Charlie picked an article and a viz about sugar and the high level of consumption of sugar in the UK by different age groups.I created a heatmap to show the consumption patterns.
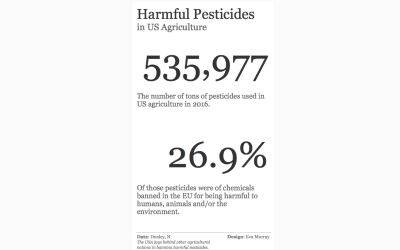
#MakeoverMonday 2020 Week 2: Harmful pesticides in US agriculture
A few weeks ago I came across a fascinating and terrifying research paper that detailed just how much pesticide use there is in the US, particularly using chemicals that are banned in many other countries because they are deemed unsafe for humans.
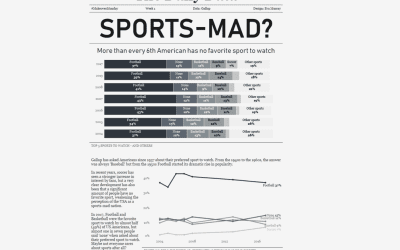
#MakeoverMonday 2020 week 1
For his first dataset, Charlie picked the topic of how popular different American sports are with spectators.In this blog I describe my Makeover approach for the original viz.
#MakeoverMonday | Week 53 |2019
So it has arrived, Andy’s last week as co-host of #MakeoverMonday. After 4 years of running this project (first with Andy Cotgreave, then with me), he is handing over the baton to Charlie to focus on other life projects.
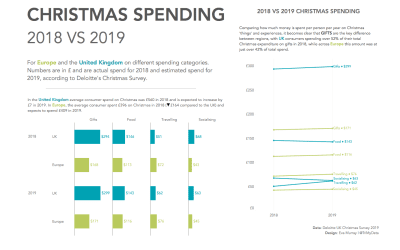
#MakeoverMonday | Week 52 | 2019: Estimated Christmas spending by concept
My last dataset for this year falls into Christmas week, so after a little convincing from Andy I set aside the data I had originally planned to use and picked a simple Christmas spending dataset from the Deloitte Christmas Survey 2019.
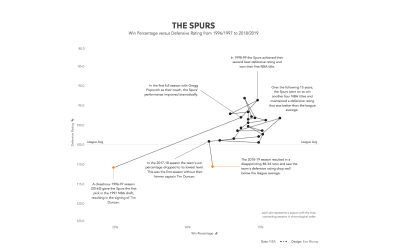
#MakeoverMonday | Week 51 | 2019: NBA Defensive Ratings
For this week, Andy chose a Basketball dataset about NBA defensive ratings with a great visualization from FiveThirtyEight
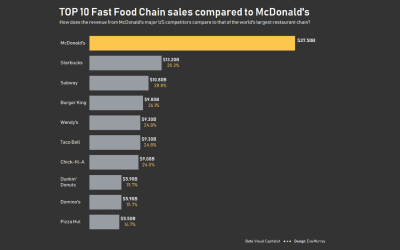
#MakeoverMonday | Week 50 | 2019: Biggest Fast Food Chains in America
For week 50 of Makeover Monday in 2019, we’re analysing the revenue of America’s biggest fast food chains. Thanks to Andy for finding the viz and the data when all my search efforts resulted in terrible results.
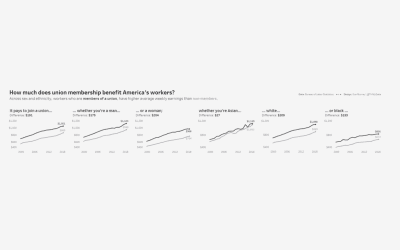
#MakeoverMonday | Week 49 | 2019: How much does union membership benefit America’s workers?
week 49, Andy picked a dataset about union membership, from an article by Mona Chalabi, who writes for the Guardian and is a recognised journalist who uses data visualisation and data art to make information more accessible.